4.3.3 SmoothingSmoothing
Summary
Smoothing is a common technique for removing noise from signals. Origin provides multiple smoothing methods, including Adjacent Averaging, Savitzky-Golay, Percentile Filter, and FFT Filter. Additionally, there is a wavelet-based tool available.
For matrix data, Origin's smoothing is performed in two ways. If the number of columns or rows is less than 32, it will expand the matrix first, then shrink it back to the original size. If greater than 31, the matrix if first shrank, then expanded.
What You Will Learn
This tutorial will show you how to:
- Smooth signals by several methods.
- Smooth signals using wavelets.
- Smooth a 3D surface.
Smoothing by Several Methods
- Start with an empty workbook. Select Help: Open Folder: Sample Folder... to open the "Samples" folder. In this folder, open the Signal Processing subfolder and find the file Signal with High Frequency Noise.dat. Drag-and-drop this file into the empty worksheet to import it.
-
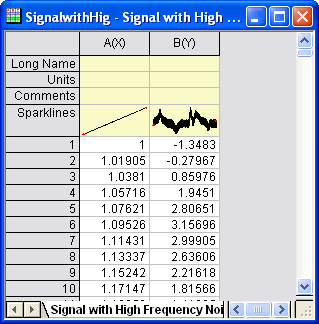
- Highlight column B in the worksheet. Then, the select menu item Analysis: Signal Processing: Smooth... (if the tool has been used before, select Open Dialog) to open the Smooth dialog box.
Adjacent-Averaging
The Adjacent-Averaging method performs a broad smoothing of data.
- Choose Adjacent-Averaging for Method. Set the Points of Window to 100 and Boundary Condition to Periodic. To preview the result in the right panel, check the Auto Preview check box.
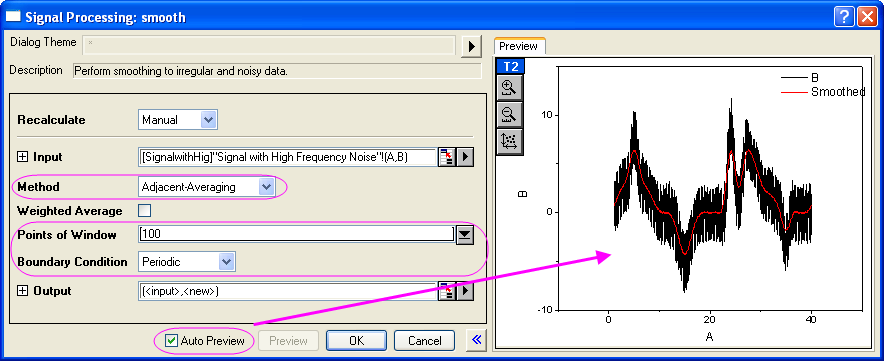
- Click OK to generate the result.
Savitzky-Golay
The Savitzky-Golay method is good for preserving the shapes of signal peaks.
- Select column B again. On the Analysis menu, click Signal Processing: Smooth:Open Dialog....
- In the smooth dialog box, set Method to Savizky-Golay. Set Points of Window to 100, Boundary Condition to Periodic and Polynomial Order to 3.
-
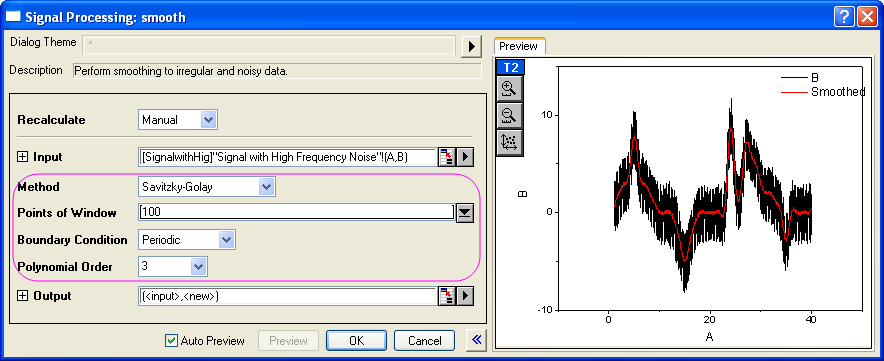
- Click OK.
Percentile Filter
- Select column B again. On the Analysis menu, click Signal Processing: Smooth:Open Dialog.....
- For Method, choose Percentile Filter. Set Points of Window to 100, Boundary Condition to Periodic, and for Percentile accept the default value of 50.
-

- Click OK button.
FFT Filter
- Select column B again. On the Analysis menu, click Signal Processing: Smooth:Open Dialog.....
- Set Method to FFT Filter. Set Points of Window to 100.
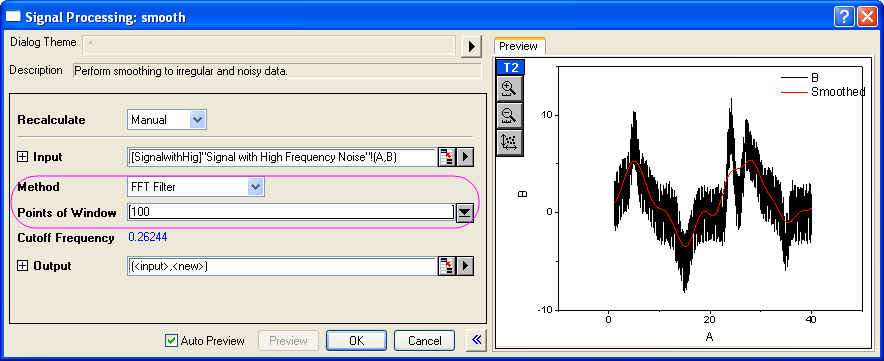
- Click OK to close the dialog box.
- Note that in the worksheet, there are now four added columns containing the results of your four smoothing operations. Highlight those four columns (C,D,E,F), then from the menu select Plot>2D: Line: Line to make a line graph with these four datasets.
-
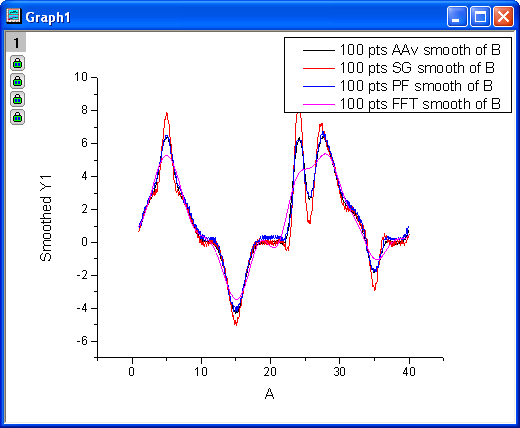
- Comparing the results of the four methods, you can see that the Savitzky-Golay method did the best job of preserving peaks in the data, while the FFT Filter method did the poorest job of preserving peaks.
Smoothing by Wavelet
- Start a new workbook. Select Help: Open Folder: Sample Folder... to open the "Samples" folder. In this folder, open the Signal Processing subfolder and find the file Signal with High Frequency Noise.dat. Drag-and-drop this file into the empty worksheet to import it.
-
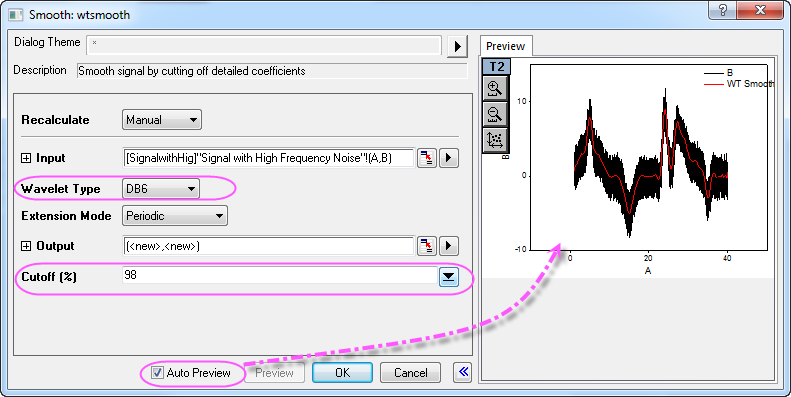
- Highlight column B, and from the menu select Analysis: Signal Processing: Wavelet: Smooth... to open the Smooth: wtsmooth dialog box.
- In the dialog, set Wavelet Type to DB6, and Cutoff (%) to 98. Check Auto Preview to preview the result in the right panel.
-
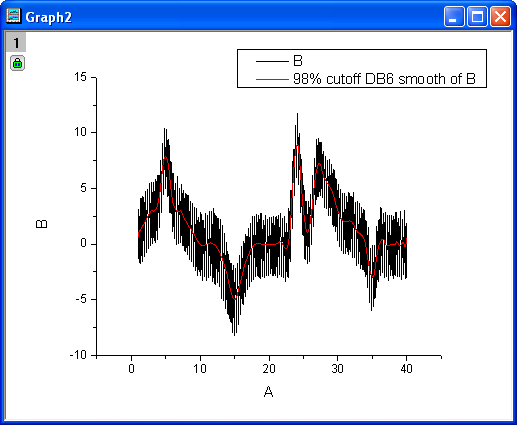
- Click OK to close the dialog box and generate your result.
- To see the difference between the original signal and the smoothed signal, highlight all columns in the worksheet and from the menu select Plot>2D: Line: Line.
-
Smoothing Matrix
- Start with a new matrixbook.
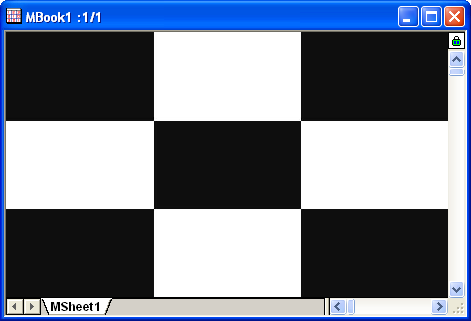
- Select menu Data: Import from File: Image to Matrix... to import the image scale.jpg under the folder <Origin Installation Directory>\Samples\Image Processing and Analysis\ (if the impImage dialog box opens, simply accept the defaults and click OK).
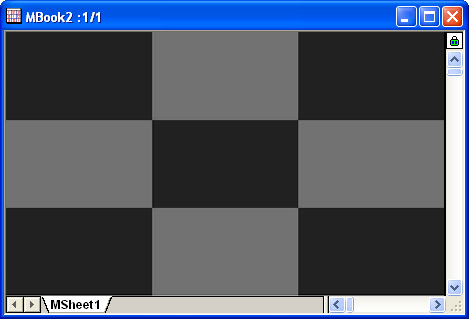
- Origin is not able to apply to perform smoothing on an image so we must convert the image to matrix data first. From the menu select Image: Conversion: Convert to Data.... Accept the dialog box default settings and Click OK.
- With the converted matrix activated, select menu View: Image Mode to view this matrix as image.
-
- To perform smoothing, select Analysis: Signal Processing: Smooth.... This opens the Smooth: msmooth dialog box.
-
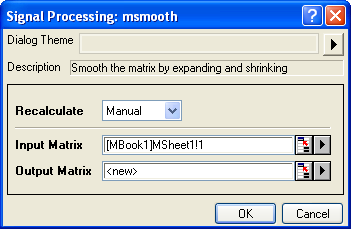
- Accept the default settings and click OK. To view the result, select View: Image Mode from the menu.
-
|