4.2.2.30 Nonlinear Multiple Variables FittingFitting-NLFit-MultiVar
Summary
Origin supports fitting functions with multiple dependent or independent variables. With the nonlinear fitting function, you can define multiple variables and separate them with semicolons. Since global fitting allows you to fit only one function at a time, this is a good way to defeat that limitation.
Origin ships with three built-in functions with multiple dependent and independent variables. These functions, available in the Multiple Variables category, are actually composites consisting of two ordinary functions. The GaussianLorentz function, for example, is a combination of the Gaussian and Lorentz functions, sharing y0 and xc:
^2}{w_1^2}}")  ^2+w_2^2}")
This tutorial will demonstrate how to fit such multi-variable functions.
What you will learn
- Use Nonlinear Multiple Variables Fitting to fit a curve with two different functions.
- Assign data to fitting variables.
Steps
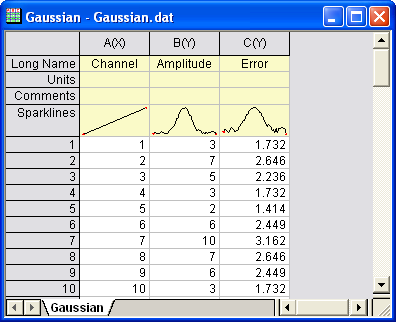
- Start with a new project or create a new workbook and import the data file \samples\curve fitting\Gaussian.dat.
- Highlight Column(A) and Column(B). In the main menu, click Analysis, then point to Fitting, and then click Nonlinear Curve Fit.
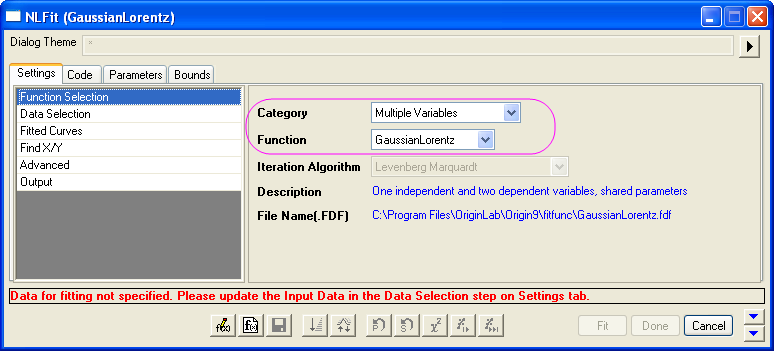
- In the NLFit dialog’s left panel, select Function Selection. In the right panel, select Multiple Variables in the Category dropdown menu. In the Function dropdown menu, select GaussianLorentz.
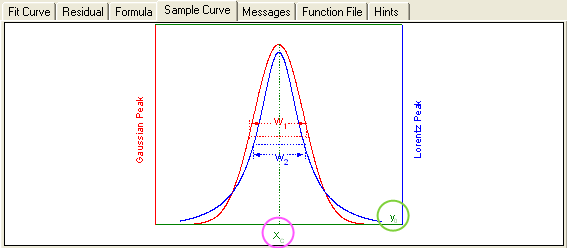
As you can see on the Sample Curve tab, the equations in this fitting function share the same parameters, y0 and xc.
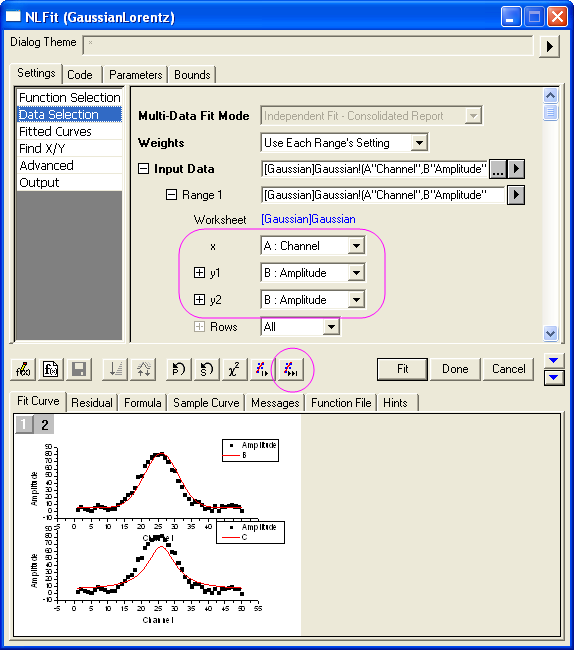
- In the NLFit dialog’s left panel, select Data Selection. In the right panel, expand the Range node and assign data to the fitting variables. In this example, we have assigned column B to both y1 and y2, which means that both expressions will fit the same dataset.
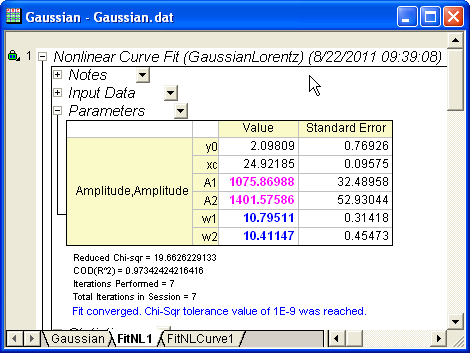
- Click Fit until converged to fit, then OK. In the results sheet, compare parameters A and w, with the Gaussian and Lorentz functions sharing the same offset and peak center.
|