4.3.1 FFT and IFFTFFT-and-IFFT
Summary
FFT (Fast Fourier Transform) is able to convert a signal from the time domain to the frequency domain. IFFT (Inverse FFT) converts a signal from the frequency domain to the time domain. The FFT of a non-periodic signal will cause the resulting frequency spectrum to suffer from leakage. Origin provides several windows for performing FFT to suppress leakage.
What You Will Learn
In this tutorial, you will learn how to:
- Perform FFT on signal with different windows.
- Recover the original signal with the spectrum.
- Perform FFT on a graph by using the FFT gadget.
FFT Gadget
Origin's FFT gadget places a rectangle object to a signal plot, allowing you to perform FFT on the data contained in the rectangle. This is convenient for quickly observing the FFT effect on the data.
The following tutorial shows how to use the FFT gadget on the signal plot.
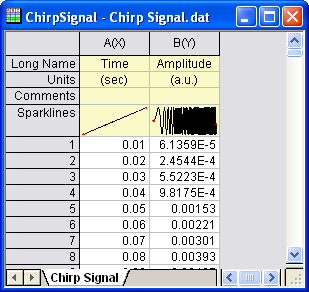
- Start with a new workbook, and import the data <Origin Installation Directly>\Samples\Signal Processing\Chirp Signal.dat.
-
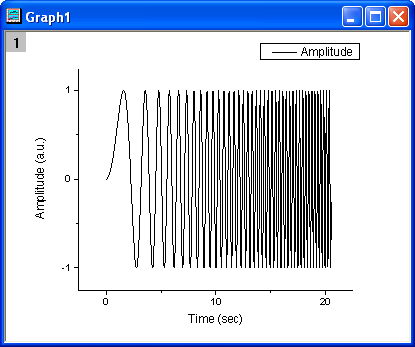
- Highlight column B and make a line plot by clicking menu item Plot>2D: Line: Line.
-
- With the plot active, select menu Gadgets: FFT... to start the FFT gadget.
-
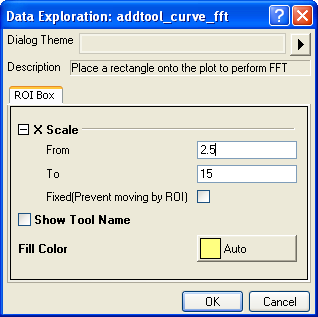
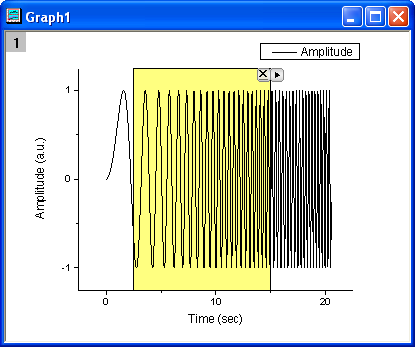
- Using the default settings, click OK to add the rectanglar Region of Interest (ROI) to the graph.
-
- Note that the FFTPREVIEW graph is created showing the FFT results for the selected data.
-
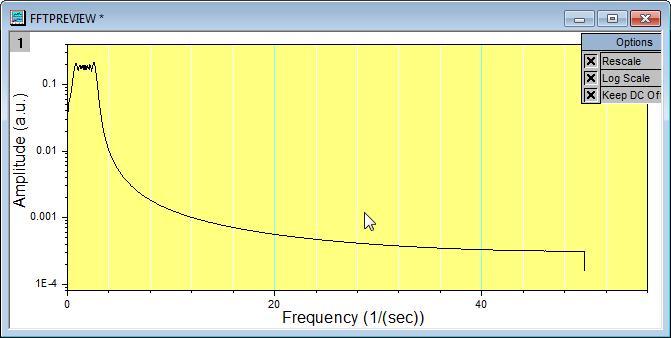
- You can move the rectangle left and right to cover different portions of the data. You can also change the width of the rectangle to cover different numbers of data points. Repositioning or resizing the ROI changes the FFTPREVIEW graph.
FFT
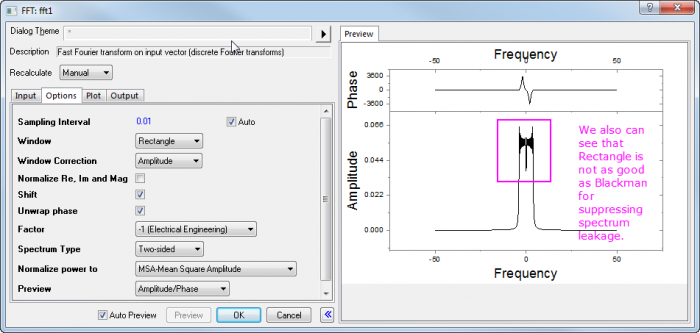
In this example, we are going to change the window for suppressing the spectrum leakage.
- Use the same data as the FFT Gadget subsection above.
- Highlight column B, then select menu Analysis: Signal Processing: FFT: FFT.... This opens the FFT: fft1 dialog box.
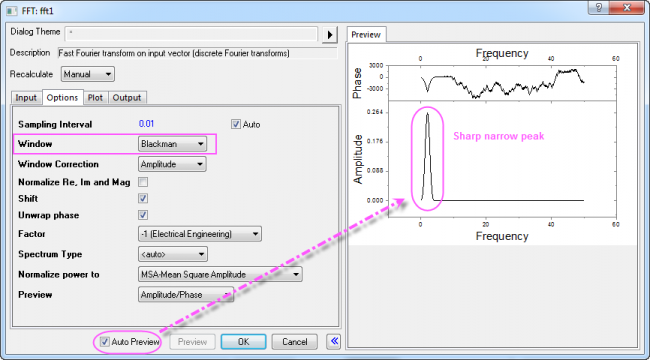
- In the dialog, check the Auto Preview box at the bottom to preview the result in the right panel. Change the Window to Blackman, but keep the remaining default settings. In the right panel, we can see that there is a sharp narrow peak spectrum for Amplitude. The Blackman window has suppressed the spectrum leakage very well.
-
- Click OK to generate the resulting data and graphs.
-
IFFT
This example will show how to recover the signal from the results of doing an FFT. To do so, both settings for FFT and IFFT need to be the same, and the Spectrum Type needs to be Two-sided and Window needs to be set to Rectangle.
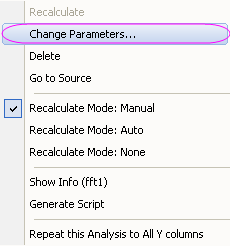
- Start with your FFT results, above, and click on any of the green locks. Select Change Parameters... from the menu to open the dialog box again.
- As mentioned above, the Window needs to be set to Rectangle, and Spectrum Type should be Two-sided, so edit these two settings.
- Click OK and the results will be modified.
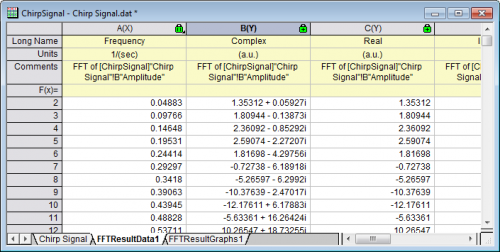
- Go to the FFTResultData1 worksheet. We can see one column is Complex, one column is Real, and one is Imaginary. Here, we can use the Complex column (the Real column and Imaginary column also can be used). Highlight it and select the menu item Analysis: Signal Processing: FFT: IFFT... to open the FFT: ifft1 dialog. (Note, if using Real and Imaginary columns, the first line for Input should be the Real column, and the Imaginary box should point to the Imaginary column.) Check the Auto Preview check box at the bottom to preview the result in the right panel.
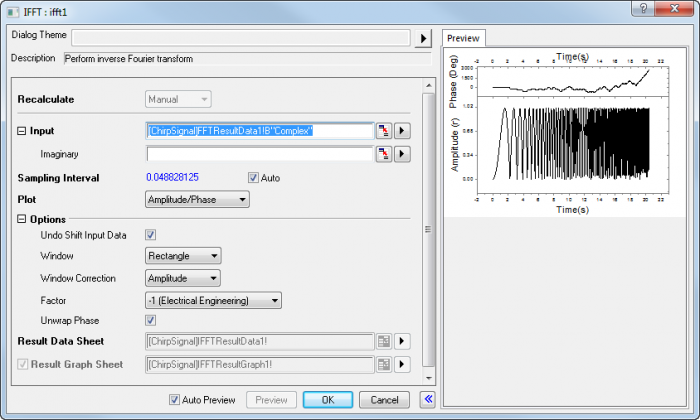
- Keep the default settings and click the OK button.
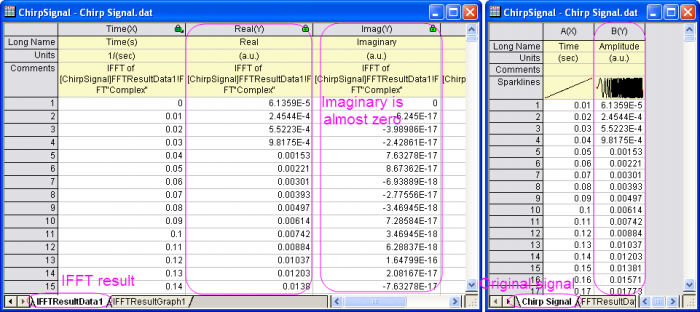
- Now, we can make a comparison between the IFFT result (in IFFTResultData1 worksheet) and the original signal data. As the image below shows, they are almost the same.
|