2.2.24 reduce_ex
Menu Information
- Worksheet: Reduce to Evenly Spaced X
- Analysis: Data Manipulation: Reduce to Evenly Spaced X
Brief Information
Reduce XY data by resampling on X
Additional Information
Minimum Origin Version Required: 8.1 SR0
Command Line Usage
reduce_ex subgroup:=inter bins:=5 method:=yfirstxfirst
X-Function Execution Options
Please refer to the page for additional option switches when accessing the x-function from script
Variables
Display
Name
|
Variable
Name
|
I/O
and
Type
|
Default
Value
|
Description
|
| Input
|
iy
|
Input
XYRange
|
<active>
|
Specifies the input data range.
|
| SubGroup
|
subgroup
|
Input
int
|
0
|
Specify the method to divide the source data into subgroups. After the dividing, each group of data points are merged into one data point.
Option list:
- ratio: Every N Points
- Merge every N data points in the input range into one data point. You can specify the number N with the rfactor variable.
- inter:By Sampling Interval
- Merge data points according to the sampling interval. You can specify the sampling interval with the dx variable.
- bins:By Number of Intervals
- Merge data points according to the number of intervals. You can specify the number of intervals with the bins variable.
- freq: By Frequency
- Merge data points according to the frequency. You can specify the frequency with the rfre variable.
|
| Sampling Interval
|
dx
|
Input
double
|
0.25
|
This is available only when By Sampling Interval is selected in SubGroup. Use it to specify the value of sampling interval.
|
| Interval Number
|
bins
|
Input
int
|
10
|
This is available only when By Number of Intervals is selected in SubGroup. Use it to specify the number of intervals.
|
| Resample Factor
|
rfactor
|
Input
int
|
4
|
This is available only when Every N Points is selected in SubGroup. It specifies the value of N.
|
| Resample Frequency
|
rfre
|
Input
double
|
8
|
This is available only when By Frequency is selected in SubGroup. It specifies the resample frequency.
|
| X Start
|
start
|
Input
double
|
<auto>
|
This is available only when Every N Points, By Number of Intervals or By Frequency is selected in SubGroup. Use it to specify the X value to start grouping.
|
| X End
|
end
|
Input
double
|
<auto>
|
This is available only when Every N Points, By Number of Intervals or By Frequency is selected in SubGroup. Use it to specify the X value to end grouping.
|
| Sampling Method
|
method
|
Input
int
|
1
|
Specifies the method to pick the Y value for the merged data point in each group.
Option list:
- yfirstxfirst: First Point
- Pick the Y value of the first data point in each group.
- ymeanxbinc:Y Mean
- Pick the mean of the Y values of the data points in each group.
- yranxbinc: Random Y(X Average)
- Pick a random number.
|
| Even Sampling Interval Tolerance(%)
|
variation
|
Input
double
|
5
|
This is available only when you Every N Points is selected in SubGroup. Use it to specify the tolerance used to check whether the input X values are evenly spaced. For more details, please refer to the Algorithm section below.
|
| Plot FFT for Preview
|
plot
|
Input
int
|
0
|
Specifies whether to plot the FFT results of the original data and the reduced data in the preview panel.
|
| Output
|
oy
|
Output
XYRange
|
(<autoX>,<new>)
|
Specifies the output range. See the syntax of Output Notations.
|
Description
This X-Function is for reducing XY data into smaller size with evenly-spaced X values.
Example
EX1
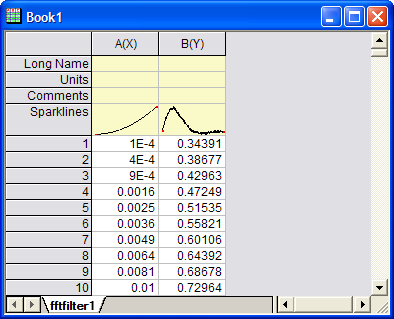
There is a dataset whose X values are not evenly spaced. The dataset contains 1000 data points.
If you perform the following steps, you will get 100 points of them. The output data will be even-sampled:
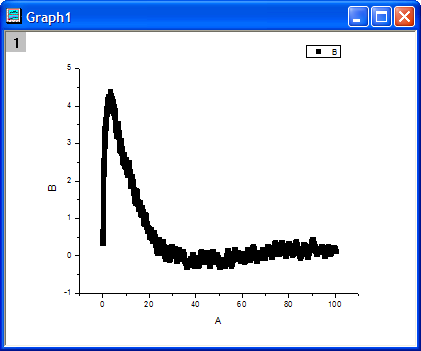
- Suppose the data is already in an Origin workbook. Highlight the data and then select Plot: Symbol: Scatter from the Origin menu to create a graph.
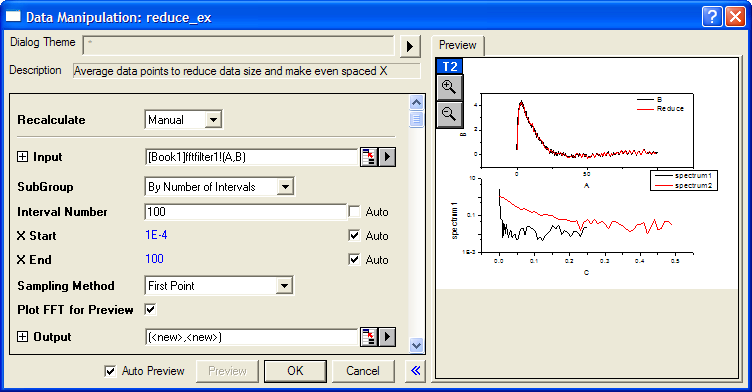
- Make the graph active. Select Analysis: Data Manipulation: Reduce to Evenly Spaced X from the main menu to open the dialog box of the reduce_ex X-Function.
- In the dialog box, check Auto Preview near the bottom .
- Select By Number of Intervals with the SubGroup drop-down list. Then uncheck Auto next to the Interval Number, and enter 100 .
- Select First Point with the Sampling Method drop-down list.
- Check Plot FFT for Preview. Then you can see the fft results of both the original data and reduced data.
- Set (<new>, <new>) as output.
- Click the OK button and you will see the results in the graph. The reduced data is next to the raw data in the input worksheet. And you can see that now the X values are evenly spaced.
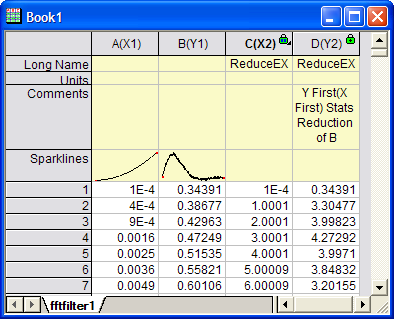
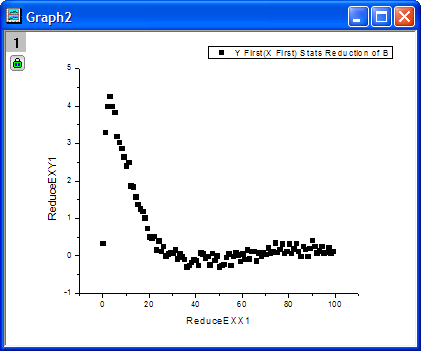
- Highlight X2 and Y2 columns in this workbook and then select Plot: Symbol: Scatter from the Origin menu to create a graph. You can see the shape is similar with the shape of the original data.
You can also use the following script command to reduce the data points (suppose the input data is highlighted before the script is executed):
reduce_ex subgroup:=bins bins:=100 method:=yfirstxfirst oy:=(<new>,<new>);
EX2
Run following LabTalk scripts to import sample data fitConv.dat and reduce it by frequency.
newbook ;
fname$=  system.path.program$+ "Samples\Curve Fitting\fitConv.dat" ;
impASC;
worksheet -s 2;
reduce_ex -r 2 subgroup:=freq;
Algorithm
- Definition of Even Sampling Interval Tolerance
When check whether the input X values are evenly spaced, it needs to specify a tolerance (from 0 to 1) for the even sampling interval. Here is the definition:
- Suppose a ascending sorted X values is
") , where , where  is the size of this vector. And the specified tolerance is is the size of this vector. And the specified tolerance is  . .
- Calculate the mean of increments of each adjacent values by
}{n - 1}") , where , where  . .
- Get a range by
") and and ") , that is, the range for testing is , that is, the range for testing is ![[M_I * \left ( 1 - tol \right ) , M_I * \left ( 1 + tol \right ) ]](//d2mvzyuse3lwjc.cloudfront.net/doc/en/XFunction/images/Reduce_ex/math-b2214c3f900d5c281f7e854aabf331aa.png?v=0 "[M_I * \left ( 1 - tol \right ) , M_I * \left ( 1 + tol \right ) ]") , including both boundary values. , including both boundary values.
- Test all the increments of each adjacent values to see whether all of them are in the range calculated from step 3, that is to say, for all increments, if satisfy
 \le x_k - x_{k-1} \le M_I * \left ( 1 + tol \right )") , where , we say this input X values are evenly spaced. , where , we say this input X values are evenly spaced.
Related X-Functions
stats, reducexy
Keywords:data reduction, sampling interval, frequency
|