2.8.4 cnormalize
Menu Information
Analysis: Mathematics: Normalize Curves (Activate a graph)
Brief Information
Normalize XY data or data plot in graph, including option to pick a reference point
Additional Information
Minimum Origin Version Required: 8.1 SR0
Command Line Usage
- cnormalize iy:=[graph1]2!2 method:=median;
- cnormalize iy:=(2,3) method:=ref ref:=1 to:=mean;
X-Function Execution Options
Please refer to the page for additional option switches when accessing the x-function from script
Variables
Display
Name
|
Variable
Name
|
I/O
and
Type
|
Default
Value
|
Description
|
| Input
|
iy
|
Input
XYRange
|
<active>
|
Specify the input curve(s) or XYRange(s).
|
| Data Info
|
datainfo
|
Input
TreeNode
|
<unassigned>
|
This is for displaying the data information in the dialog. When you are using the X-Function by LabTalk, please do not use this variable.
|
| Treat Input as One Composite Dataset
|
composite
|
Input
int
|
0
|
Specify whether to treat selection as one composite dataset. This variable is not available when method is set to specify or pt.
|
| Normalize Methods
|
method
|
Input
int
|
1
|
Specify the method used to normalize the input data
Option list:
- specify:Divided by a specified value {0}
- Divide the curve by a value specified by the val variable.
- range:Normalize to [0, 1] {1}
- Normalize the curve to the range [0, 1].
- range100:Normalize to [0, 100] {13}
- Normalize data to the range [0, 100]. (9.0 SR0)
- snd:Z scores (standardize to N(0, 1)) {2}
- Transform the curve to the standard normal distribution.
- max:Divided by Max {3}
- Divide the curve by the maximum Y value.
- min:Divided by Min {4}
- Divide the curve by the minimum Y value.
- mean:Divided by Mean {5}
- Divide the curve by the mean of the Y values.
- median:Divided by Median {6}
- Divide the curve by the median of the Y values.
- sd:Divided by SD {7}
- Divide the curve by the standard deviation of the Y values.
- norm:Divided by Norm {8}
- Divide the curve by the norm of the Y values.
- mode:Divided by Mode {9}
- Divide the curve by the mode of the Y values.
- sum:Divided by Sum {10}
- Divide the curve by the sum of the Y values.
- ref:Use Reference Plot {11}
- Normalize the curve using a reference curve specified by the ref variable.
- pt:Normalize to Point Picked from Graph {12}
- Normalize the curve using a reference point picked from graph. To specify a reference point, one can pick a particular data point from a graph by double-click on it or assign the X and Y value of the reference point in Pickx, picky respectively.
|
| User-Defined Value
|
val
|
Input
double
|
1.0
|
This variable is available only when method is set to specify. It specifies the value used to divide in the input curve.
|
| Reference Plot
|
ref
|
Input
XYRange
|
<optional>
|
This variable is available only when method is set to ref. It specifies the reference plot (XYRange).
|
| Normalize to
|
to
|
Input
int
|
0
|
This variable is available only when method is set to ref. It determines which statistical variable in reference column is used as the normalization match. After normalization, the chosen statistical variable of input column will match that of the reference plot.
Option list:
- min:Min
- Normalize the input curves such that the min value of each curve matches that of the reference.
- max:Max
- Normalize the input curves such that the max value of each curve matches that of the reference.
- mean:Mean
- Normalize the input curves such that the mean value of each curve matches that of the reference.
- median:Median
- Normalize the input curves such that the median value of each curve matches that of the reference.
- sum:Sum
- Normalize the input curves such that the sum of each curve matches that of the reference.
|
| Pick
|
pick
|
Input
int
|
0
|
This is the Pick Point button in the dialog. It is for selecting the reference point in the dialog. It is available only when method is set to pt. When using the X-Function by LabTalk, you can either use mouse to pick up a data point from a graph or specify the pickx, picky, and pickidx in the script window.
To select a data point using mouse, set method to pt and then press Enter on keyboard without specifying the pickx, picky, and pickidx variables. The mouse cursor becomes  . You can select one point from the graph and double-click on this point to execute normalization. . You can select one point from the graph and double-click on this point to execute normalization.
To select a data point using script, please see the description of pickx, picky, and pickidx below.
|
| Picked Point's X Value
|
pickx
|
Input
double
|
<unassigned>
|
This variable is available only when "method" is set to "pt". It specifies the X value of the reference point.
|
| Picked Point's Y Value
|
picky
|
Input
double
|
<unassigned>
|
This varialbe is available only when "method" is set to "pt". It specifies the Y value of the reference point.
|
| Picked Point's Index
|
pickidx
|
Input
int
|
|
This variable is available only when "method" is set to "pt". It specifies the index number of the reference point.
|
| Reference Point
|
refpoint
|
Input
Range
|
|
Specify the Reference Point.
|
| Output
|
oy
|
Output
XYRange
|
(<input>,<new>)
|
Specify the output for the normalized curves.
|
Description
This function adjusts curve(s) or part of the curve(s) to a specific "standard" level one by one. It treats each selected curve indepently and normalizes all the curves one by one.
Examples
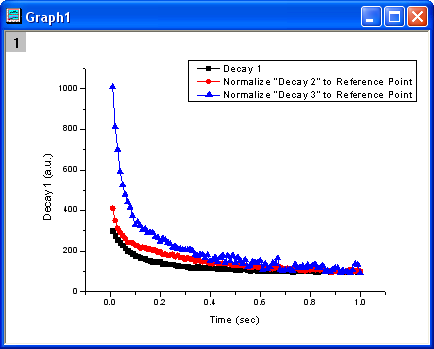
The following example shows you how to normalize two curves to a data point picked from the graph.
- import the file \Samples\Curve Fitting\Exponential Decay.dat.
- Highlight the columns B to D and select Plot: Line+Symbol: Line+Symbol from the Origin menu to create a graph.
- Activate the graph. Select Analysis: Mathematics: Normalize Curves from the Origin menu to bring up the cnormalize dialog box.
- Select plots "Decay 2" and "Decay 3" for Input. The input curves' information is listed in Total Data info branch.
- Select Normalize to Point Picked from Graph from the Normalize Methods drop-down list. Click the Pick Point button next to pick. Then the dialog box minimizes. You can pick a data point from the graph as the reference point. Double-click on a desired point to return to the dialog box. Now the picked point's X, Y values and index is listed below pick.
- Click the rightsided arrow button next to Output. Select <input>: XY = input XY from the fly-out menu.
- Click the OK button to execute. The normalized curves should replace the original curves. All three curves should go through the picked reference point:
Algorithm
Suppose  is the is the  values of input curve, values of input curve,  is a user defined value, is a user defined value,  and and  are the picked data point's x and y values, and Y_{input} is the input curve's y value when its x value equals to . The normalized curve, are the picked data point's x and y values, and Y_{input} is the input curve's y value when its x value equals to . The normalized curve,  is: is:
Divided by a specific value:

Normalize to [0, 1]:

Normalize to [0, 100]:
}{Y_{max}-Y_{min}}")
Z scores (standardize to N(0, 1)):

Divided by Max:

Divided by Min:

Divided by Mean:

Divided by Median:

Divided by Standard Derivation:

Divided by Norm:


 is the n th values. is the n th values.
Divided by Mode:

Divided by Sum:

Normalized to the max of the reference plot

Normalization to min, mean, median, or sum of the reference plot is done in the same manner.
Normalize to point picked from graph

|
Note: When pt is selected for method, you can pick any data point in the graph as the reference point. If the picked data point's x value is not one of the x values of input curve, linear interpolation will be proceeded to get the proper divisor factor. And then the curve will be normalized to the reference point according to the expression above.
|
Related X-Functions
Vnormalize, normalize, Rnormalize
|