5.7.1 Kaplan-Meier EstimatorKaplan-Meier-Estimator
Summary
Survival analysis is the study of the time until a certain event, such as a death or failure in treatment. It also called event history analysis in social science, or reliability analysis in engineering.
The Survival function, S(t), can describe the survival rate at time t. Further, S(t)=1-F(f), where F(t) is the cumulative distribution function of the failure times. While The hazard function h(t) (also known as the failure rate, hazard rate, or force of mortality) is the ratio of the probability density function P(t) of F(t) to the survival function S(t).
The Kaplan-Meier Estimator, also called product-limit estimator, provides an estimate of S(t) and h(t) from a sample of failure times which may be progressively right-censored.
What you will learn
This tutorial will show you how to:
- Perform Kaplan-Meier Estimator
- How to interpret the results
Steps
Running Kaplan-Meier Estimator
Scientist is looking for a better medicine for cancer resistance. After exposing some rats to a carcinogen DMBA, they apply different medicine to different groups of rats and record their survival status for first 60 hours. In the 1st group, 15 rats survived after being exposed, on which Medicine 1 is applied. Note that on the 30th hours, 1 rat is dead but not for carcinoma. In the 2nd group, 15 rats survived with drug 2 applied. Note that on the 14th hour, the 15th hour and the 25th hour, 1 rat die but not because of carcinoma. And the records of two groups rats are sorted in the file /Samples/Statistics/SurvivedRats.dat. Note that in Status, 0 = dead but not because of carcinoma, 1 = dead because of carcinoma, 2 = alive.
- Start with an empty worksheet. Select Help: Open Folder: Sample Folder... to open the "Samples" folder. In this folder, open the Statistics subfolder and find the file SurvivedRats.dat. Drag-and-drop this file into the empty worksheet to import it.
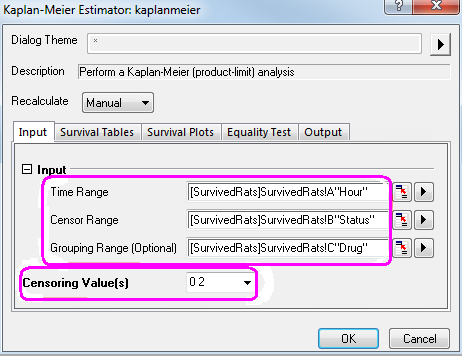
- Analyze the dataset using the Kaplan-Meier Estimate tool. Use the menu item Statistics: Survival Analysis: Kaplan-Meier Estimator to open the dialog.
- Set column A, B and C as Time Range, Censor Range and Grouping Range respectively in the Input tab.
- Set 0 and 2 as Censored Value(s)
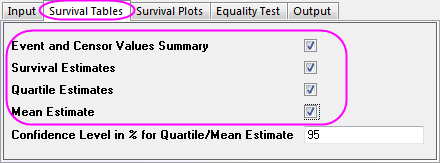
- In the Survival Table tab, select the Event and censor values Summary , Survival Estimates, Quartile Estimates and Mean Estimates check boxes.
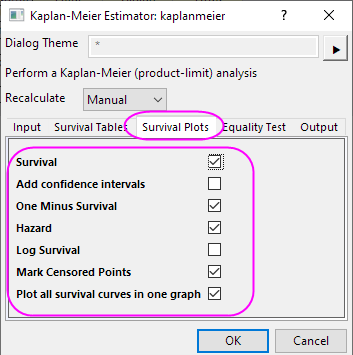
- Select Survival ,One Minus survival and Hazard check box in the Survival Plots tab.
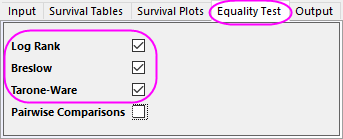
- Select the Log-Rank, Breslow and Tarone-Ware check box in the Equality Test tab.
- Click the OK button.
Interpreting the Results
Go to worksheet KaplanMeier1 for the analysis report :
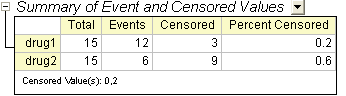
- From the "summary of event and censored values" table, we can see that Censored=3 and Percent Censored =0.2 for drug 1 group and Censored=9 and Percent Censored=0.6 for drug 2 group.
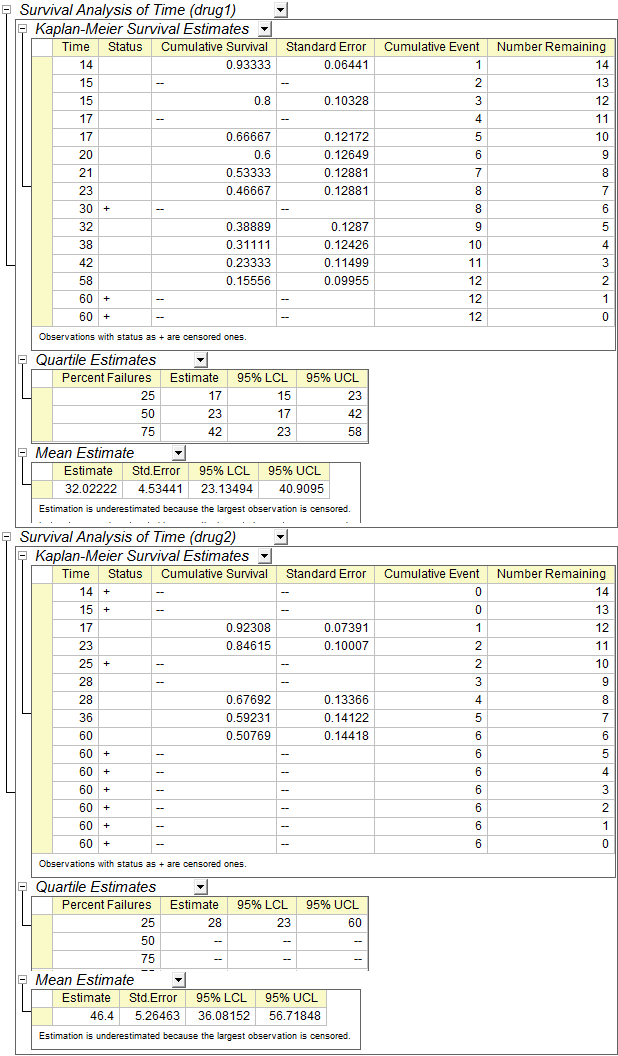
- "Kaplan-Meier Survival Estimates " tables display a descriptive procedure for examining the distribution of time-to-event variables. We also can compare the distribution by levels of a factor variable. Quartile Estimates and Means Estimates table Provides the estimates and confidence interval of quartile and mean.
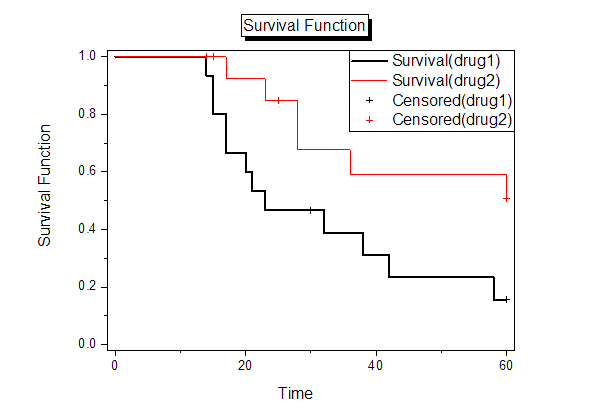
- The survival curves give a visual representation of the life tables. A plot of the Kaplan-Meier estimate of the survival function is a series of horizontal steps of declining magnitude. In the plot, the survival curve declines more rapidly, the survival rate is smaller.This Survival function plot shows proportion of individuals surviving at each hour for drug 1 group and drug2 group and the survival curve of drug1 always declines more rapidly, so we can conclude that drug 2 is one better medicine for cancer resistance.
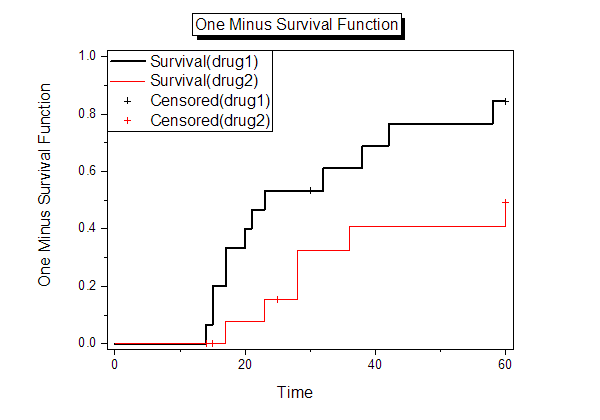
- Form one minus survival function, we can get the same conclusion as Survival function plot.
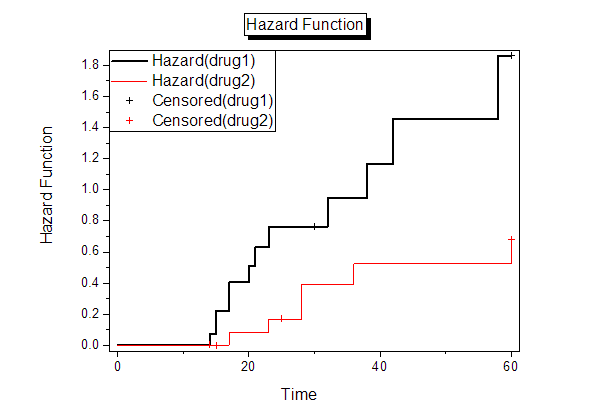
- Hazard rate is the instantaneous probability of the given event occurring at any point in time.It can be plotted against time on the X axis, forming a graph of the hazard rate over time. And hazard function is the equation that describe this plotted line.From the graph, we can get the hazard rate of drug1 group is greater than drug 2 group. So we can conclude that drug 2 is one better medicine for cancer resistance.
- For overall tests of the equality of survival times across groups, Origin provides three methods:
- Log rank: Tests equality of survival functions by weighting all time points the same.
- Breslow: Tests equality of survival functions by weighting all time points by the number of cases at risk at each time point.
- Tarone-Ware: Tests equality of survival functions by weighting all time points by the square root of the number of cases at risk at each time point.
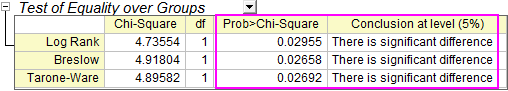 - Since the significance values of the tests are all smaller than 0.05, there is statistically significant difference between two treatments(drug1 and drug2) in survival time.
|