5.7.3 Weibull FitWeibull-Fit
Summary
Weibull fit is a kind of parameter method to analyze the relationship between the survival function and failure time. After analysis, we can get parameter estimates, which can determine survival function and hazard function of Weibull distribution .
Weibull distribution:
=\frac{b}{a }({\frac{x-\theta }{a }})^{b-1}e^{(-\left({\frac{x-\theta }{a }}\right)^{b})}") where where  , for , for 
Survival function:
=e^{(-\left({\frac{x-\theta }{a}}\right)^{b})}")
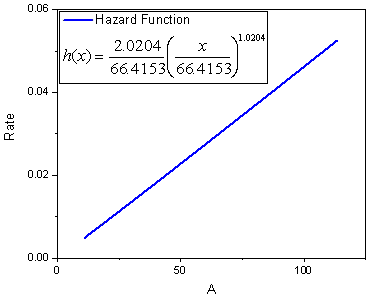
Hazard function:
=\frac{b}{a}\left({\frac{x-\theta }{a}}\right)^{b-1}")
where b is the shape parameter,  is the scale parameter, and is the scale parameter, and  is the location parameter. In Origin, Weibull fit only discusses b and a, and assumes = 0. is the location parameter. In Origin, Weibull fit only discusses b and a, and assumes = 0.
If b > 1 the hazard increases , if b = 1 the hazard is constant(exponential model), if b < 1 the hazard decreases.
Minimum Origin Version Required: OriginPro 9.1 SR0
What you will learn
This tutorial will show you how to:
- Perform Weibull Fit
- How to explain analysis report
Perform Weibull Fit
- Start with an empty worksheet. Select Help: Open Folder: Sample Folder... to open the "Samples" folder. In this folder, open the Statistics subfolder and find the file weibull fit.dat. Drag-and-drop this file into the empty worksheet to import it.
- Select Statistics: Survival Analysis: weibull fit to open the dialog.
- Put the A(X) column into Time Range. Similarly, put the B(Y) column into Censor Range.
- Select 0 as the censoring value form censoring value(s) drop-down list.
- Expand Plots branch and check Survival Plot and Hazard Plot.
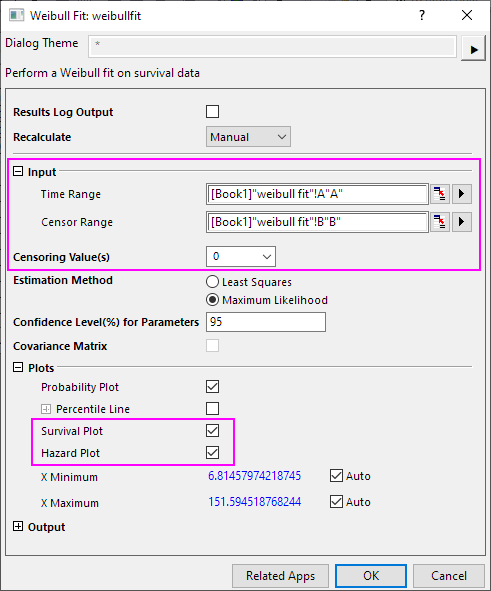
- Click the OK button to perform the Weibull fit analysis.
Interpreting the Result
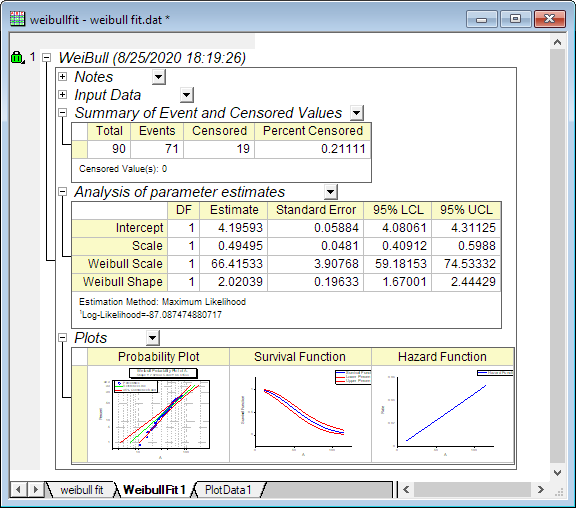
Go to worksheet WeibullFit1 for the analysis report.
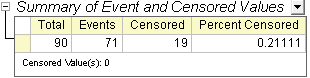
- From the "Summary of Event and Censored Values" table , we can see that censored =19 and percent Censored =0.2111.
- From the "Analysis of parameter estimates", we can get all parameter estimates for Weibull distribution.
Intercept==4.1959, ( is the intercept of the small extreme distribution, = ln(Weibull Scale))
Weibull Scale=  =66.4153, =66.4153,
Weibull Shape=c=2.0204,
Scale =0.495 (scale = 1/c).
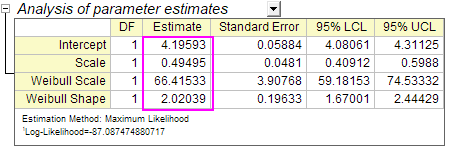 - c > 1,so we can conclude that the hazard increases as time.
- Furthermore, we can get the survival function and hazard function:
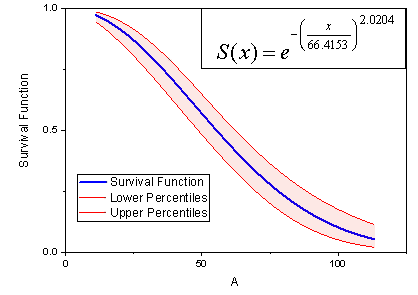 
|