5.5 Stepping Into, Over or Out of FunctionsStepping-Into-Over-Or-Out-Of-Functions
Stepping Into a Function
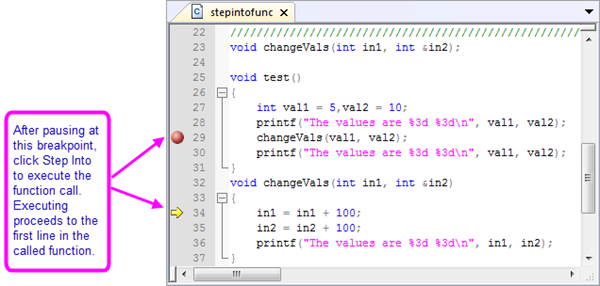
First, pause the program in debug mode at the function call line. To do this, do one of the following:
- Set a breakpoint at the function call line.
- Step through your code line by line until you reach the function call. While the program is paused at the function call line, click the Step Into button
 on the Debug toolbar or select Debug:Step Into. on the Debug toolbar or select Debug:Step Into.
The debugger executes the function call statement and then pauses execution at the first line of the called function.
To continue executing your code one line at a time, click the Step Into button.
Stepping Over a Function
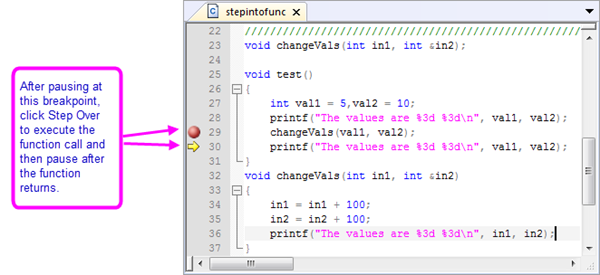
The Step Into feature lets you step through a called function to check for logic errors in the function. However, you can also step over a called function. To do this, pause the code execution at the function call line that you want to step over (either by setting a breakpoint or by executing line by line up to the function call). While the program is paused at the function call line, click the Step Over button  on the Debug toolbar or select Debug:Step Over. on the Debug toolbar or select Debug:Step Over.
The debugger executes the function call and then pauses after the function returns.
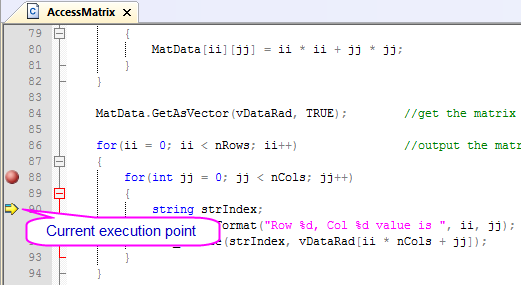
In addition, you can user hotkey: Alt+Num* quickly locate to the current execution point.
Stepping Out of a Function
When execution is paused inside a function, you can click the Step Out button  on the Debug toolbar or select Debug:Step Out to step out of the function. The debugger executes the rest of the function without pausing, and then returns to the line after the function call and pauses. on the Debug toolbar or select Debug:Step Out to step out of the function. The debugger executes the rest of the function without pausing, and then returns to the line after the function call and pauses.
Viewing the Function Calls and Going to a Function
If the function that you are calling to start your program contains calls to other functions, you can use the Call Stack window (View:Call Stack) to see the name of the function (and source code line number) that is currently executing as well as the functions that have been called but have not yet returned control to the calling function. When a function is called, it is added to the top of the Call Stack window. When a function returns control to the calling function, it is removed from the Call Stack window.
For example, in the following pseudo code:
void test1()
{
  lines of code;
  test2();
}

void test2()
{
  lines of code;
  test3();
  return;
}

void test3()
{
  lines of code;
  return;
}
If you add a breakpoint in the test3 function and then start debugging the program, when program execution pauses in the test3 function, the Call Stack window will display the following call stack (where ## indicates the line number):
test3 line ##

test2 line ##

test1 line ##
To activate the cursor at a function call line in the source code, double-click on the respective function in the Call Stack window.
|