2.14.2.26 pef_pptslide
Menu Information
Beginning with Origin 2021b, this routine is replaced in the user-interface by the Send Graphs to PowerPoint App that is pre-installed with the Origin software. The pef_pptslide X-Function remains a part of the Origin software and can be called via script or by typing the following in the Script Window:
pef_pptslide -d; // opens the pef_pptslide dialog box
pef_pptslide -h; // dumps parameters to the Script Window
Brief Information
Send selected graphs to PowerPoint
Additional Information
Minimum Origin Version Required: 2016 SR0
Command Line Usage
1.pef_pptslide export:=recursive;
2.pef_pptslide export:=open top:=10 left:=10 bottom:=10 right:=10 title:=bottom;
3.pef_pptslide embed:=1 title:=top mode:=lname slide:=2 slidemode:=insert;
4.pef_pptslide export:=page title:=top mode:=lname slidemode:=insert srcf:="C:\Program Files\OriginLab\Origin2016\Samples\Import and Export\Column_Plots_in_Sample_OPJ.pptx" dstf:=E:\MyOriginGraphs.pptx;
X-Function Execution Options
Please refer to the page for additional option switches when accessing the x-function from script
Variables
Display
Name
|
Variable
Name
|
I/O
and
Type
|
Default
Value
|
Description
|
| Select Graph(s)
|
export
|
Input
int
|
0
|
Specify which graph(s) to be exported to PowerPoint slides.
Option list:
- folder{0}:All in Active Folder
- All the graph pages in active folder of the project (see this in Project Explorer) will be exported. The pages in subfolders will not be included. Hidden pages will also be included, while embedded graph pages in worksheet will not be included.
- recursive{1}: All in Active Folder (Recursive)
- All the graph pages in active folder of the project (see this in Project Explorer) will be exported. The subfolders will be recursively included.
- open{2}: All in Active Folder (Open)
- All the opened (not hidden) pages in active folder of the project will be exported.
- project{3}: All in Project
- All the graph pages in the project will be exported. Hidden graph pages will be included while embedded pages will not.
- page{4}: Active Page
- Currently active page will be exported.
- specified{5} Specified
- Other than the options above. Specify the pages in Graph Page below.
|
| Include Embedded Graphs
|
embed
|
Input
int
|
0
|
Specify whether to export embedded graphs to PowerPoint slides.
|
| Insert Graphs as
|
insert
|
Input
int
|
1
|
Specify the form of graphs when exported to PowerPoint slides.
Option list:
- pic{0}:Picture
- Export graphs to PowerPoint slides as pictures.
- embed{1}:Embedded Object
- Export graphs to PowerPoint slides as embedded objects.
|
| Top Margin (%)
|
top
|
Input
double
|
0
|
Specify the top margin of the slide.
|
| Left Margin (%)
|
left
|
Input
double
|
0
|
Specify the left margin of the slide.
|
| Bottom Margin (%)
|
bottom
|
Input
double
|
0
|
Specify the bottom margin of the slide.
|
| Right Margin (%)
|
right
|
Input
double
|
0
|
Specify the right margin of the slide.
|
| Keep Aspect Ratio
|
keepratio
|
Input
int
|
1
|
Specify whether to keep aspect ratio.
|
| Title Line
|
title
|
Input
int
|
0
|
Specifies how the title will be shown in the PowerPoint slides.
Option list:
- none{0}:None
- Do not show the title.
- top{1}:Top of Slide
- Show the title at the top of screen.
- bottom{2}:Bottom of Slide
- Show the title at the bottom of screen.
|
| Title Mode
|
mode
|
Input
int
|
1
|
This variable is only available when the title variable is not 0. It specifies what should be used as the exported graph title in each slide.
Option list:
- custom{0}:Custom
- Use a customized string(supports substitution notation) as title.
- sname{1}:Window Short Name
- Use the short name of each graph window as title.
- lname{2}: Window Long Name
- Use the long name of each graph window as title.
- lsname{3}: Window Short and Long Name
- Use the short name and long name of each graph window as title.
- path{4}: Window Path
- Use the file path of each graph window in Project Explorer as title.
|
| Custom Title String
|
custom
|
Input
string
|
<unassigned>
|
This variable is only writable when mode is set to custom. Used in specifying a custom string to be used as slide title.
|
| Starting Slide Index
|
slide
|
Input
int
|
1
|
Define the starting slide index number in the PowerPoint presentation file.
|
| Slide Mode
|
slidemode
|
Input
int
|
1
|
Specify the slide mode for exported graphs.
Option list:
- insert{0}: Start New
- Starting new slide for each exported graph.
- replace{1}: Overlay Existing
- Replace existing slide(s).
|
| Load File/Template (Optional)
|
srcf
|
Input
string
|
<unassigned>
|
Specify a PowerPoint template file for the exported slides.
|
| Save File As (Optional)
|
dstf
|
Input
string
|
<unassigned>
|
Specify the path and name of the PowerPoint Presentation file (*.ppt;*.pptx;*.pptm), PowerPoint Show (*.pps;*.ppsx;*.ppsm) or Design Template (*.pot;*.potx;*.potm) to be saved. Slides will be exported to this file.
|
Description
This function is capable of exporting specified graphs to PowerPoint slides. Each graph will be pasted into one slide in the PowerPoint file.
It offers an option to allow you to select graphs within project, folders or subfolders and whether to skip the hidden graphs that are not shortcuts.
The order of exportation is as following:
The graphs in the top folder will be exported first, then the graphs in subfolder will be exported. If there are more than one subfolder, alphabetical order will be applied to process the subfolders. For graphs in the same folder, the slide indices (index of Slide column in the Project Explorer, which can be change by dragging and dropping graphs in the Project Explorer.) of the graphs will be applied.
Note: To export graphs to PowerPoint slides, Microsoft Office must have been installed. If the version of Office is 2007, Office has to be upgraded to SP2. Or this X-Function will not work fine.
Examples
The following example can be worked in two ways: The first part of the example uses the user-interface and the pef_pptslide X-Function dialog box. The second part shows the same example being entirely scripted.
- Open the project named <Origin Installation Directory>\Samples\Graphing\Customizing Graphs.opj.
- Highlight the root folder (Customizing Graphs) of the project.
- Click Window: Script Window and at the prompt, type the following and press Enter:
pef_pptslide -d
- In the pef_pptslide dialog, change the settings as the following image shows. For Load File/Template(Optional) browse to and add <Origin Installation Directory>\Samples\Import and Export\Column_Plots_in_Sample_OPJ.pptx.
- For Save File As(Optional), enter some convenient path and name for your output ppt(x) file.
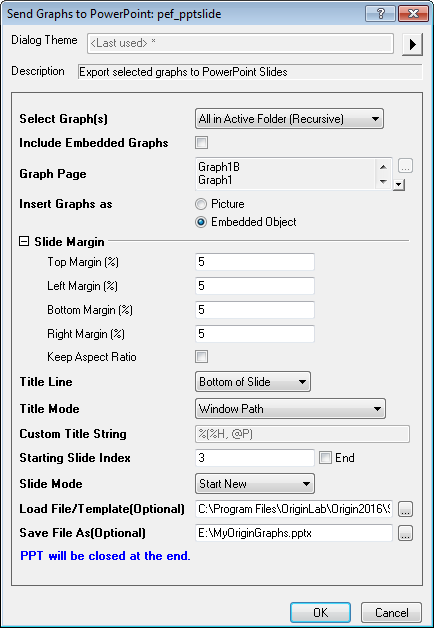
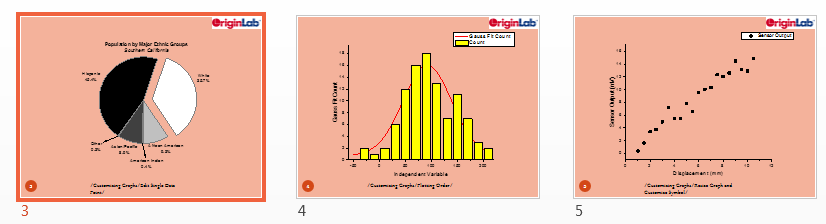
- Click the OK button. The graphs in the project will be sent as embedded objects to the newly-created PowerPoint file. You can browse to and open the output file. Slides 3, 4 and 5 should appear as in the image below. Hint: if you lost track of your output file, you can find the save path by clicking on the Messages Log tab to the left side of your Origin workspace.
Script Solution:
- Run Origin and (a) close any open projects and (b) make sure that your PowerPoint software is not running.
- Copy the following script to the Script Window (Window: Script Window), highlight the entire script and press Enter.
string outname$ = %YMyOriginGraphs.pptx;
string pptname$ = SYSTEM.PATH.PROGRAM$ + "Samples\Import and Export\Column_Plots_in_Sample_OPJ.pptx";
string fname$ = SYSTEM.PATH.PROGRAM$ + "Samples\Graphing\Customizing Graphs.opj";
doc -o %(fname$);
pef_pptslide export:=recursive insert:=pic top:=5 left:=5 bottom:=5 right:=5 keepratio:=0 title:=bottom mode:=path slide:=3 slidemode:=insert srcf:="%(pptname$)" dstf:="%(outname$)";
type -b "Your Script Has Completed!";
After the script runs, you should be able to browse to your \User Files (Help: Open Folder: User Files) and find your pptx file named as MyOriginGraphs.pptx.
Related X-Functions
pef_slideshow,pemp_pptslide, pef_slideshow
Keywords:publishing, export
|