9.1.1 Connect to Web Data by Copy Link AddressWeb-Connect-Copy-Link
Summary
Data Connectors are an ideal way to create a "live link" to data files that are periodically updated. Traditional file import requires the user to re-import data each time source data are modified. However, once a Connector is added to a workbook, it can automatically query the data source each time the project is opened, thus simplifying your data management tasks.
In this tutorial, we'll show you how to connect to "real-time" earthquake data on the United States Geological Survey (USGS) website, how to configure the connected project to automatically import data on open, and how to manage data caching so that you are assured of getting the most up-to-date data each time you open your project.
Minimum Origin Version Required: Origin 2021
What you will learn
- How to connect to a web-stored CSV file by copying the URL.
- How to use Origin's free Maps Online App to create a background image for geographic data.
- How to use the Plot Setup dialog with Data Connector-imported data, saving us the need to rearrange columns.
- How to save and reopen a project that uses a Web Connector (CSV).
- How to manipulate Origin's caching mechanism so that data are always refreshed on opening the project.
Connect to Web Data File by Copy Link Address
- Start a new project. There should be one new workbook visible in the workspace.
- Browse to this page on the USGS website: https://earthquake.usgs.gov/earthquakes/feed/v1.0/csv.php
- In the right-hand column, you'll see under "Feeds", a list of links to CSV data files that are updated every minute.
- Scroll down and under "Past 30 Days", right-click on "All Earthquakes" and choose Copy link address.
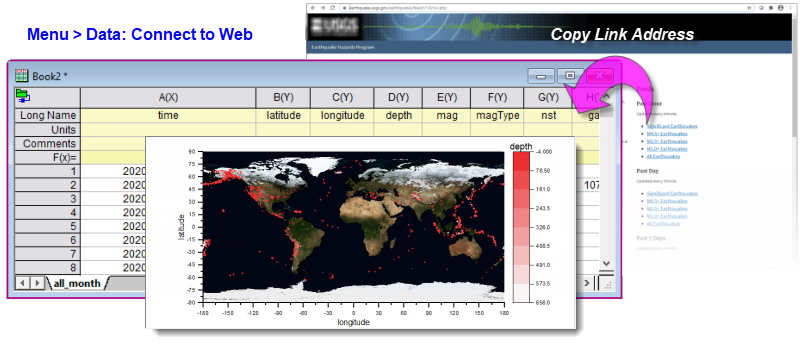
- Return to Origin and with your workbook active, choose Data: Connect to Web.
- Paste the link address you just copied into the URL box using CTRL + V and click OK.
- Accept default settings in the CSV Import Options dialog box and click OK. The data from the USGS site are imported into the workbook. Note the green color of the Connector icon
 , indicating that the data connection is valid. , indicating that the data connection is valid.
Plotting Connector-imported Data with Plot Setup
In this portion of the tutorial, we will use OriginLab's free Maps Online App to create a base-map for a scatter plot of latitude, longitude, magnitude and depth data.
Because of the "locked" nature of Data Connector-imported data, we cannot rearrange columns. By default, Origin requires that X data columns be to the left of Y data columns. But in our locked worksheet, the X data (longitude) are to the right of our Y data (latitude). The Plot Setup dialog box works nicely in this situation, as we can designate columns "on the fly" without having to move things around (and lose the "live" connection to our data). But first, we will get our free Maps Online App:
- Press F10 to open the App Center. Click on the Search tab and with Category = All, enter "maps" into the search box. If the Maps Online App shows with a green checkmark beside it, you have already installed the App. If it displays the Download and Install icon
 , click the icon to install the App in your Origin software. , click the icon to install the App in your Origin software.
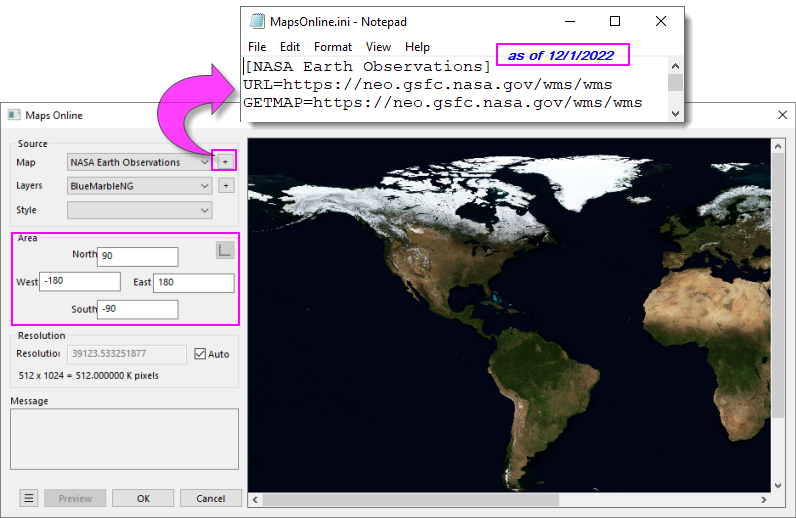
- Click on the Apps Gallery (by default, docked to the right side of your workspace) and launch the Maps Online App. In the dialog box, click the Map drop-down and choose Nasa Earth Observations and set Layers to BlueMarbleNG.
- Enter lat and long values into the North, South, East and West fields as shown below, then click OK. We now have a base-map for plotting our earthquake data.
NOTE: The Maps Online App queries a WMS server. These servers often change. If you find a broken service, try and locate an updated URL. Then, click the  button beside the Map drop-down to open a text file. You can edit or add services (URLs) to the text file, making sure to follow the syntax used in the file, then save changes. button beside the Map drop-down to open a text file. You can edit or add services (URLs) to the text file, making sure to follow the syntax used in the file, then save changes.
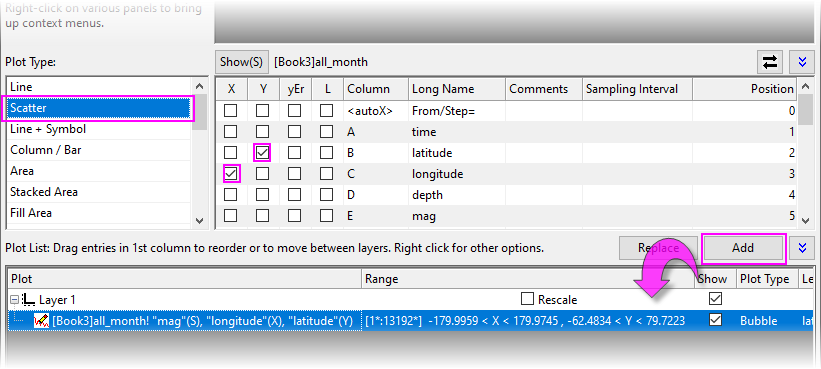
- From the menu, choose Graph: Plot Setup (if not displayed, expand top and bottom panels of the dialog box). Set Available Data = Worksheets in Folder and you should see your all-month sheet in the top panel. Highlight the sheet in the top panel.
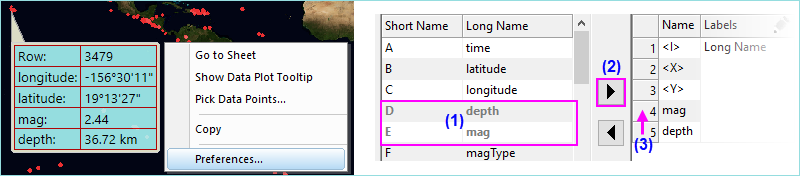
- In the middle panel set Plot Type = Scatter and set longitude = X and latitude = Y, as shown. Now, click the Add button in the lower-right corner of the middle panel. Click OK to overlay the scatter plot of lat-lon data on your map.
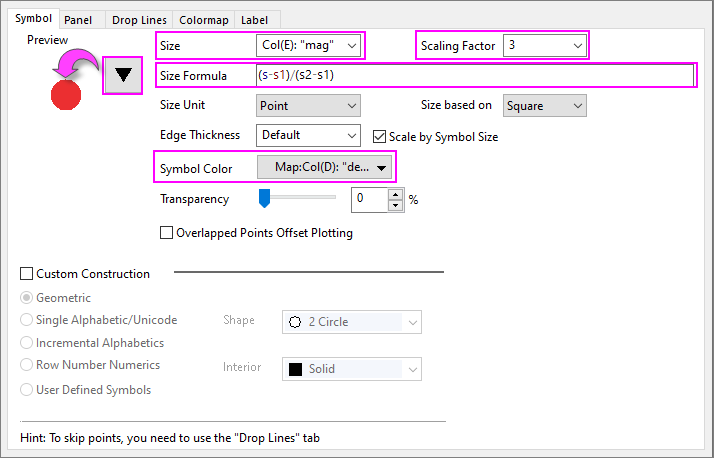
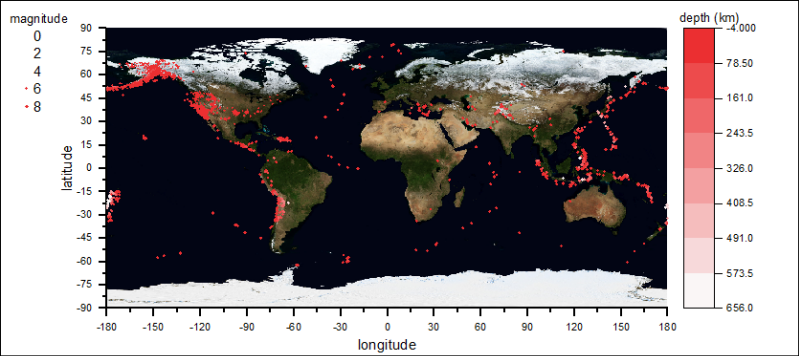
- Double-click on the plot to open Plot Details and recreate the settings show in the following screen-cap by setting these Symbol tab controls: Size = Col(E): "mag", Scaling Factor = 3, Size Formula = (s-s1)/(s2-s1), Symbol Color = By Points set to Map:Col(D):"depth" (hint: edit your colormap on the Colormap tab of Plot Details). In summary, we are using latitude and longitude values to locate our scatter points on the map; we are using mag (magnitude) data to control symbol size and depth to control symbol color. Click OK to close the dialog.
- On the Tools toolbar, click the Add Color Scale button, then double-click on the color scale to open Color Scale Control dialog. On the Levels tab, Hide Head Level and Hide Tail Level. On the Layout tab, clear the Reverse Order box. On the Title tab, check the Show box. Click OK to close the dialog. You can also add a Bubble Scale to the map to show relative symbol sizes (since size is mapped to earthquake magnitude).
- We can make a few cosmetic adjustments to our graph such as using Print/Dimensions settings to modify page size to more closely fit the aspect ratio of the map image. Additionally, we can add axis titles, and adjust fonts and font sizes using Mini Toolbar buttons.
 | If you hover on a plotted point in your graph, you will see a customizable data point tooltip. Carefully right-click on the tooltip, choose Preferences and you can modify the tooltip to display all of your plot variables -- latitude, longitude, magnitude and depth, in any order and in any numeric format -- as you mouse over your plot.
|
How to Manage Caching of Web Data
Data Connectors were conceived, in part, to facilitate import of very large data files. Connectors employ the strategy of not saving large file imports (> 500kB by default), thus saving on disk space. If you have a number of connected workbooks in your project file, you can selectively re-connect to files as needed, allowing you to import just the data that you need to access now.
In an effort to manage the number of times a connection is refreshed -- this takes time and can slow work, after all -- OriginLab developers added system variable @CFDT, which controls the length of time between Connector queries of source data. Data imported by Connect to Web is cached for a time period equal to the value of @CFDT seconds per 100kB of file size (e.g connected data in a 10MB file is cached for 900 * 100 = 90,000 sec or ~24 hr).
Additionally, there is a LabTalk command -- delete -web -- that will flush the cache on demand. For the purposes of our earthquake project, we would like to ensure that we are always getting the most up-to-date data, so we will make use of this.
In this portion of the exercise, we will configure our project so that:
- Data are automatically imported whenever the project is opened.
- The cache is flushed on project open so that we are certain of always having the most up-to-date information.
- Choose File: Save Project As, give the file a name such as USGS_Earthquake_All_30d.opju and click Save.
- Click on the worksheet's Connector icon and choose Auto Import > On Project Open.
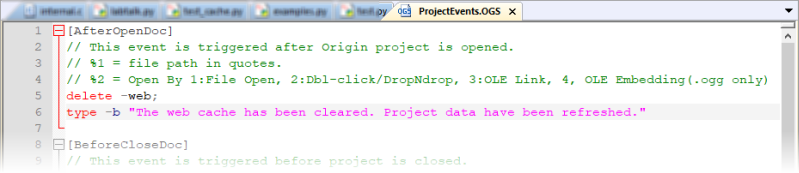
- From the Origin menu, choose View: Code Builder. Code Builder is Origin's integrated development environment (IDE) for developing LabTalk, Origin C and Python code. In the Workspace pane on the left side of the dialog, expand the Project branch and double-click on the ProjectEvents.OGS file. The file is loaded into Code Builder workspace. ProjectEvents.OGS is a special file that is saved with each Origin project and is used to store and execute LabTalk script at various event triggers such as upon opening of the project. We have already mentioned that we have a LabTalk command that can be used to flush the cached web data so we will customize ProjectEvents.OGS to run a simple line of script so that our web data are always refreshed on project open. Scroll up to the section [AfterOpenDoc], add the following two lines of script, then click the Save button on the Code Builder toolbar.
delete -web;
type -b "The web cache has been cleared. Project data have been refreshed."
ProjectEvents should look something like this:
- Choose File: Save to save your project, along with the contents of ProjectEvents.OGS.
- Now, close your project, then using File: Recent Projects, click on your recently-saved-and-closed project. An attention message should open stating that the "web cache has been cleared. Project data have been refreshed." Subsequently, the worksheet should fill with data and the plot of earthquakes on the world map, should be regenerated.
|