5.4.1 Non-parametric Statistics OverviewNonparametricStatisticsOverview
Summary
Nonparametric tests are used when you don't know whether your data are normally distributed, or when you have confirmed that your data are not normally distributed.
What you will learn
This tutorial will show you:
- An introduction on non-parametric tests in Origin
- How to run the non-parametric tests for different practical situations
- How to calculate correlation coefficient in non-parametric statistics
Introduction: Nonparametric Tests in Origin
Nonparametric tests do not require the assumption of normality. They are commonly used in the following situations:
- Small sample size.
- Categorical/Binary/Ordinal data.
- Normal distribution cannot be assumed.
|
|
|
Nonparametric
|
Parametric
|
|
|
|
Data from any distribution
|
Data from normal distribution
|
| Small Samples
|
Large Samples
|
| One Sample
|
|
Wilcoxon Signed Rank Test
|
One Sample T-Test
|
| Two Samples
|
Independent Samples
|
- Mann-Whitney test
- Kolmogorov-Smirnov test
|
Two Sample T-Test
|
| Paired Samples
|
- Wilcoxon signed rank Test
- Sign Test
|
Paired Sample T-Test
|
| Multiple Samples
|
Independent Samples
|
- Kruskal-Wallis ANOVA
- Mood's Median Test
|
One Way ANOVA
|
| Related Samples
|
Friedman ANOVA
|
One Way Repeated Measure ANOVA
|
Examples
One Sample Independent Tests
The One-Sample Wilcoxon Signed Rank test is designed to examine the population median relative to a specified value. You may choose a one- or two-tailed test. The Wilcoxon signed rank test hypotheses are
H0: median = hypothesized median versus H1: median ≠ hypothesized median.
In this example, a quality engineer in a production shop is interested in whether median (or average) of the weight of product is equal to 166. So select 10 product at random and measured their weight . The data measured as following:
151.5 152.4 153.2 156.3 179.1 180.2 160.5 180.8 149.2 188.0
The engineer perform Normality Test to determine if the distribution of the data is normal distribution
- Open a new worksheet and input the above data in col(A). Select Statistics: Descriptive Statistics: Normality Test... to open the Normality Test dialog.
- Select A(X) as Data range.
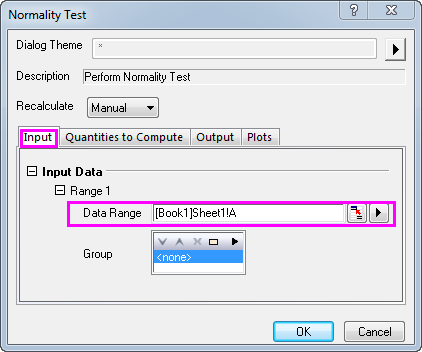
- Click the OK button to generate results.
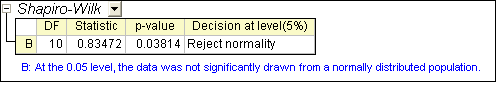
According to result,P-value=0.03814,the distribution of the data is not normal distribution at the 0.05 level. So, perform One-Sample Wilcoxon Signed Rank test:
- Select Statistics: Nonparametric Tests: One-sample Wilcoxon Signed Rank Test... to open the dialog.
- Set column A as Data Range.
- Input 166 in Test Median text box.
-
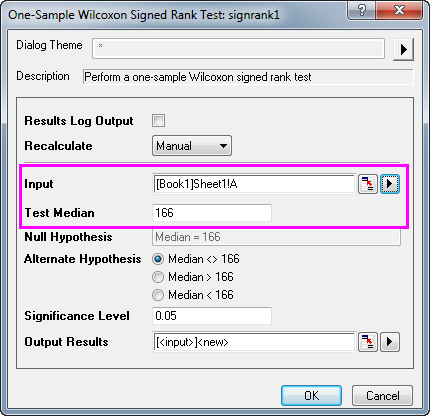
- Click the OK button to generate results

According to the result, it fails to reject null hypothesis at the 0.05 level and concludes that the median is equal to 166.
Two Sample Independent Tests
Origin provides two tests for non-parametric statistics of two sample independent system: the Mann-Whitney Test and Two Sample Kolmogorov-Smirnov Test.
This following example shows the practical use of Mann-Whitney Test. The abrasions(in mg) are measured for two types of tires(A and B), 8 experiments were carried out for each tire type. The data is indexed and stored in abrasion_indexed.dat file.
- Import the abrasion_indexed.dat file from \Samples\Statistics\
- Select Statistics: Nonparametric Tests: Mann-Whitney Test to open the dialog.
- Keep Input Data Form as Index
- Set column A as Group Range, set column B as Data Range.
- Select the Exact P Value check box.
-
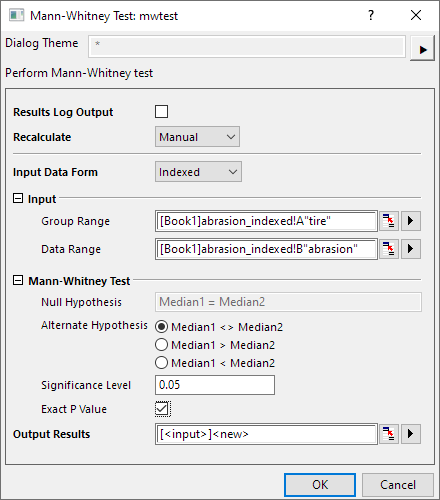
- Click the OK button to generate results, which should be in the MannWhitney1 sheet
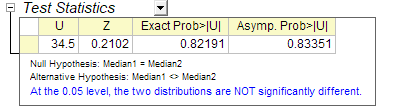
- U: The U statistic can be simply calculated from the rank of two groups. It is the number of times a score in the 2nd group is larger than a score in the 1st group.
- Z: The approximate Normal test statistic. It provides an excellent approximation as the sample size grows.
- Exact Prob: The exact p-value, only available when Exact P Value is selected in the dialog. However, it could be very CPU-time consuming for large sample size.
- Asymp.Prob: The asymptotic p-value calculated from the approximate Normal test statistic, Z
Non-parametric Measures of Correlation
Correlation coefficient is used as a measure of relationship between two variables.It is possible to calculate the correlation coefficient for non-parametric statistics.
Origin provides two non-parametric methods to measure the correlations between variables:
- Spearman: common substitution of Pearson correlation coefficient,Spearman's coefficient can be used when both dependent ( variable and independent variable are ordinal numeric, or when one variable is a ordinal numeric and the other is a continuous variable. However, it can also be appropriate to use Spearman's correlation when both variables are continuous.
- Kendall: Used with ordinal variables for assessing agreement among raters
The following example shows how to calculate correlation coefficient for non-parametric situations.
- Import the abrasion_raw.dat file from Samples\Statistics;
- Highlight Column A and column B. Select Statistics:Descriptive Statistics:Correlation Coefficient to open the corrcoef dialog;
- Check Spearman and uncheck Pearson;
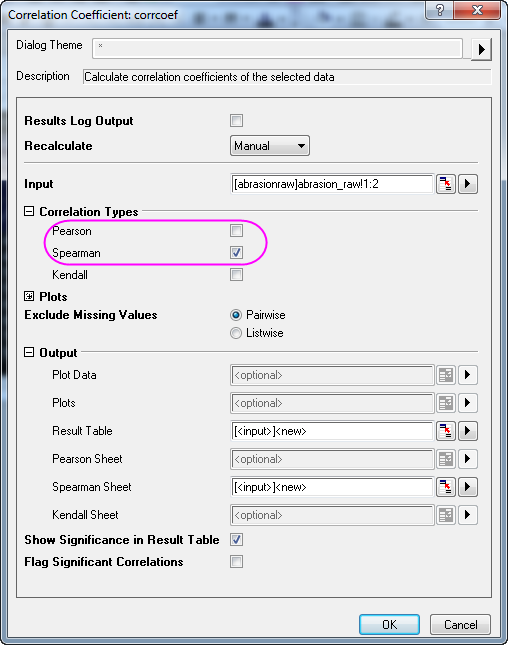
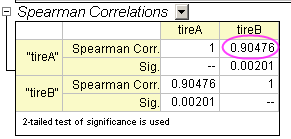
- Click the OK button to generate the results, in the CorrCoef1 sheet.
From the value of Spearman Corr., it can be concluded that the abrasion between tire A and tire B are strongly related.
Paired Sample wilcoxon Signed Rank Tests
We will compare the two medians of tire A and tire B in above example.
- Continue with the abrasion_raw.dat file from Samples\Statistics;
- Select Statistics: Nonparametric Tests: Paired Sample wilcoxon Signed Rank Tests to open the dialog;
- Selcet Column A as 1st Range Data and column B as 2nd range Data;
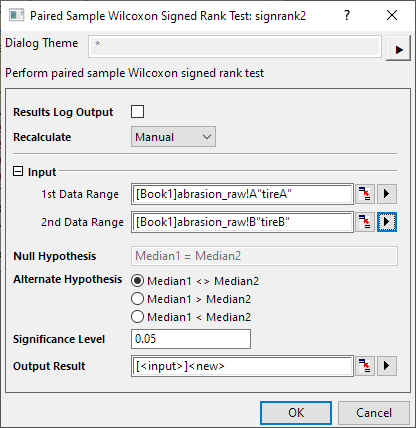
- Click the OK button to generate the results.
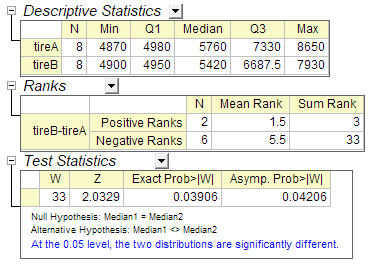
We can conclude that two medians are significantly different. Obviously, median of group A is larger than that of group B.
Multiple Independent Samples Test
In this example, the gas mileage of four car makers are measured. Several experiments are carried out for each car makers. The results are listed in the sample data table.
| GMC/mpg
|
Infinity/mpg
|
Saab/mpg
|
Kia/mpg
|
| 26.1
|
32.2
|
24.5
|
28.4
|
| 28.4
|
34.3
|
23.5
|
34.2
|
| 24.3
|
29.5
|
26.4
|
29.5
|
| 26.2
|
35.6
|
27.1
|
32.2
|
| 27.8
|
32.5
|
29.9
|
|
| 30.6
|
30.2
|
|
|
| 28.1
|
|
|
|
To evaluate whether the gas mileage of the four car makers are equal, and which one is the most efficient, Kruskal-Wallis ANOVA is chosen as the nonparametric test method.
- Create a new workbook in Origin, copy the sample data and paste into it;
- Select Statistics:Nonparametric Tests:Kruskal-Wallis ANOVA to open the kwanova dialog;
- Specify Raw as Input Data Form;
- Click the triangle button
 next to Input, and select All Columns in the context menu; next to Input, and select All Columns in the context menu;
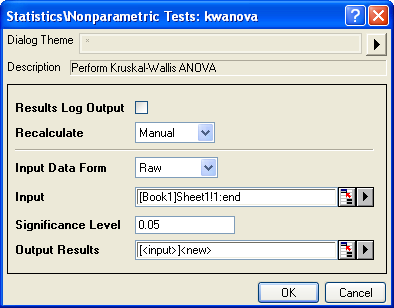
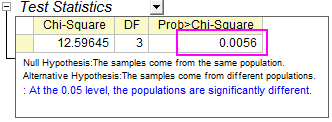
- Click the OK button to generate results, the results are stored in a new worksheet KWANOVA1.
From the p-value we can conclude that gas mileage of the four car makers are significant different.
Multiple Related Samples Test
Ophthalmologists are investigating whether laser He-Ne therapy works for children. They have data from 2 groups, 6-10 Years Old and 11-16 Years Old. Each data set contains study of 5 persons' naked-eye eyesight difference after 3 period of therapy. The results are stored in the eyesight.dat.
Due to the small sample size, non-parametric statistics would be needed in analysis, following the steps below:
- Import the eyesight.dat file from \Samples\Statistics\;
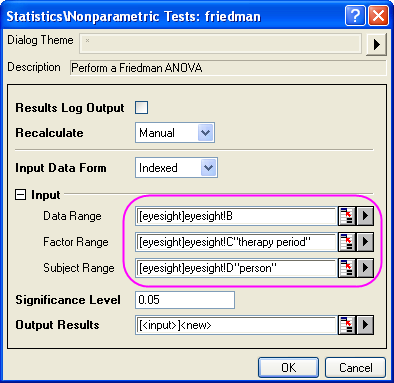
- Select Statistics:Nonparametric Tests:Friedman ANOVA to open the friedman dialog;
- Select Column A as Data Range, Column C as Factor Range, and Column D as Subject Range;
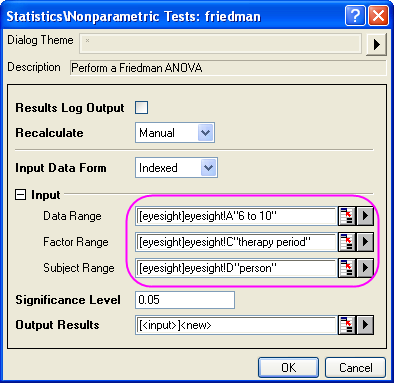
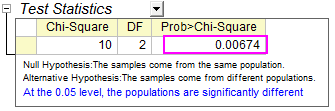
- Click the OK button to generate results.
The p-value of  is 0.0067379, which is less than 0.05. The populations are significantly different, indicating that the therapy are effective for the age group 6-10. is 0.0067379, which is less than 0.05. The populations are significantly different, indicating that the therapy are effective for the age group 6-10.
In a similar way, choose column B as Data Range and the rest setting of Input are the same with Step 3 previously.
Check the result, we can see that p-value of  is 0.02599, less than 0.05 or 0.10. So we can also conclude that eyesight of 11-16 years old kids is better after 3 period of therapy. is 0.02599, less than 0.05 or 0.10. So we can also conclude that eyesight of 11-16 years old kids is better after 3 period of therapy.
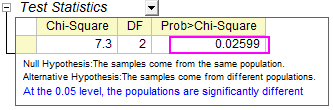
And we can see that >,that means, laser He-Ne therapy works better on 6-10 years old kids. The earlier children are to be involved in therapy, the more their eyesight can be improved.
|