Description:
This is a polar scatter plot, with X/Y error bars added by co-selecting xEr± and yEr± datasets when plotting.
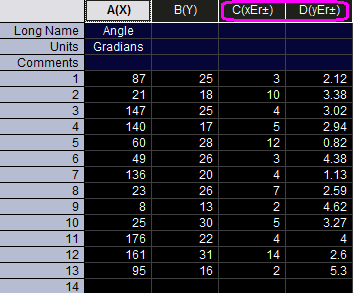
With the four columns of data selected and the worksheet active, click Plot: Specialized: Polar theta(X) r(Y) and change the plot type to scatter.
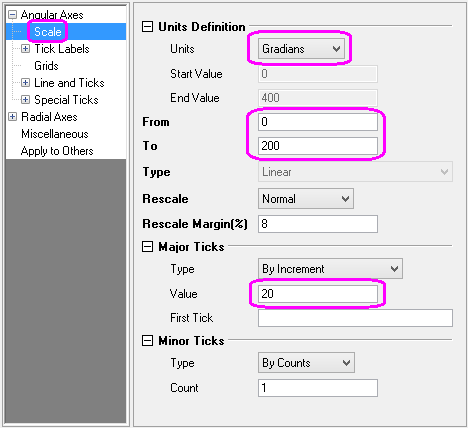
In the Axis Dialog, set angular axis scale range and unit in Scale tab to make a semi-circle gradian unit plot.
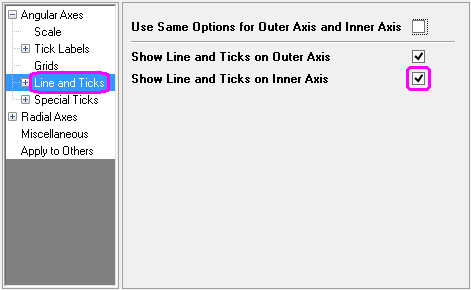
To show inner angular axis without labels, go to Line and Ticks tab.
You can refer to this tutorial to learn how to customize the radial axis.