Statistical Methods for Quality Control
Statistical methods for quality Control involve the use of collected data and quality standards to find new ways to improve products and services. These methods characteristically involve attempts to infer the properties of a large collection of data.
OriginPro provides various methods and tools for quality control:
Statistical Process Control (SPC)
The Statistical Process Control (SPC) App, for OriginPro brings together five key SPC features:
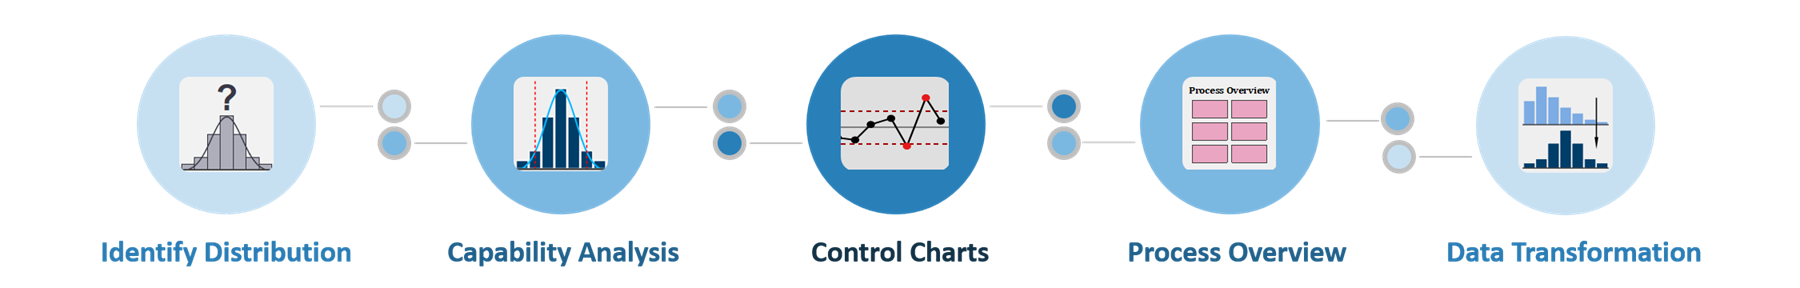
Control Charts
The SPC App offers a wide variety of configurable control charts:
For Subgroups
- Xbar-R
- Xbar-S
- I-MR-R/S
- Xbar
- R
- S
- Zone
For Individuals
- I-MR
- Z-MR
- Individuals
- Moving Range
Attributes Charts
- P/U Chart Diagnostic
- P/U Chart
- Laney P' / U'
- NP
- C
Time-Weighted Charts
- Moving Average
- EWMA
- CUSUM
Process Overview
The Process Overview tool in the SPC app offers reports with charts and capability statistics. It helps you to identify problem areas and gain insights into your data:
- Xbar / Individuals charts
- Probability plot
- Capability histogram
- Capability plot
- Capability statistics
Capability Analysis
Capability analysis is used to detect whether a process meets specifications. The SPC app provides following features of capability analysis:
- Capability Histogram
- Cp, Cpk, Cpm, Pp, Ppk ect
- Performance Report
- Support different data types
- Normal
- Between/Within
- Non-normal
- Binomial
- Poisson
Data Transformation
The SPC app provides 3 transformation functions to make data approximately normal:
- Box-Cox Transform
- Johnson Transform
- Yeo-Johnson Transform
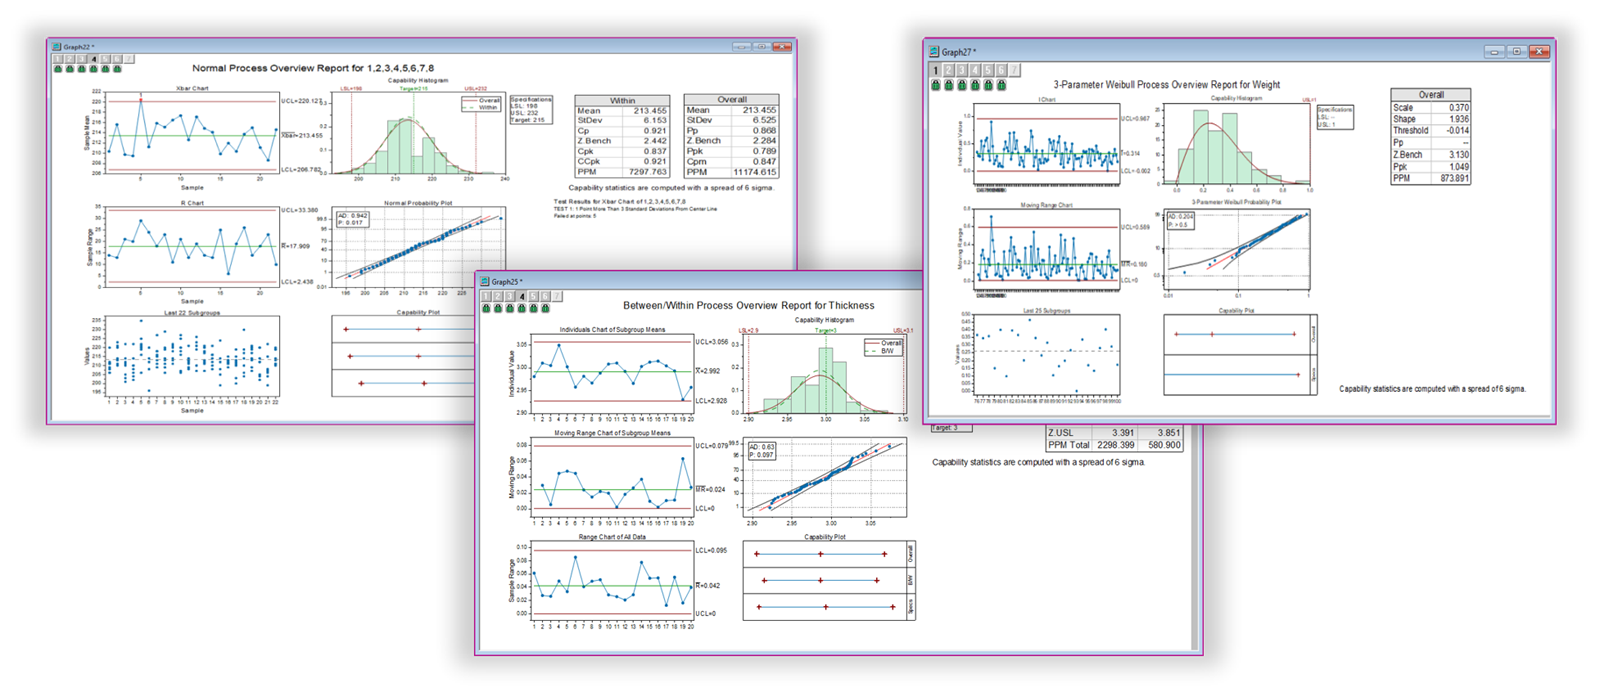
The Process Overview tools generate a combination report with multiple charts and statistics. It enables a user to assess the quality or capability of a process in a glance
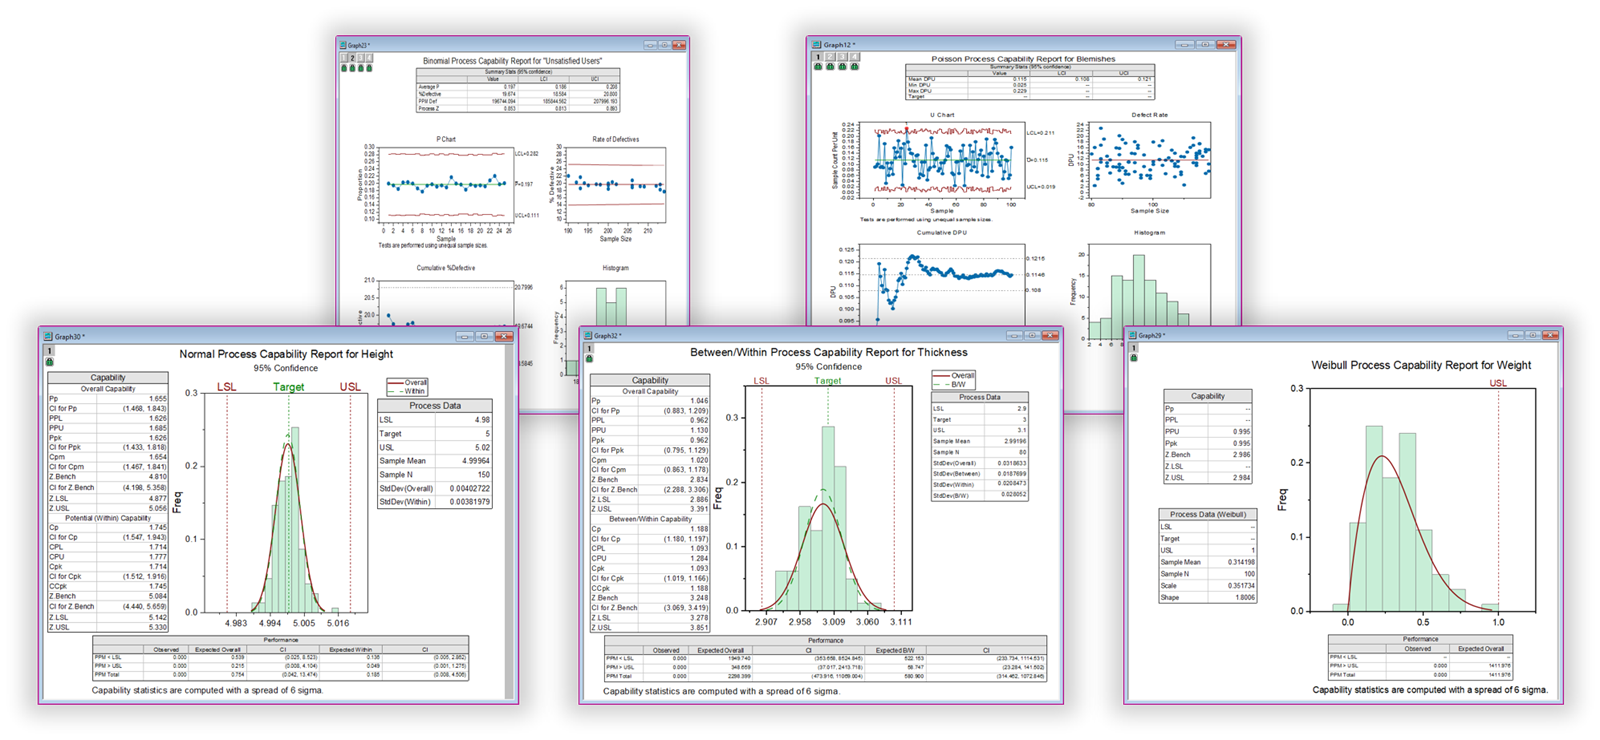
The reports of Capability Analysis include control charts and capability reports with Cp, Cpk, Pp and Ppk indices, to help the user to access whether the process meet the specifications
Identify Data Distribution
The SPC App provides 14 distributions and 3 transformation functions to help to identify your data distribution:
- Normal
- Logistic
- Lognormal / 3-Parameter-Lognormal
- Log-logistic
- Weibull / 3-Parameter Weibull
- Gamma
- Rayleigh
- Smallest Extreme Value
- Largest Extreme Value
- Exponential / 2-Parameter Exponential
- Gaussian Mixture
- Folded Normal
- Box-Cox Transformation
- Johnson Transformation
- Yeo-Johnson Transformation
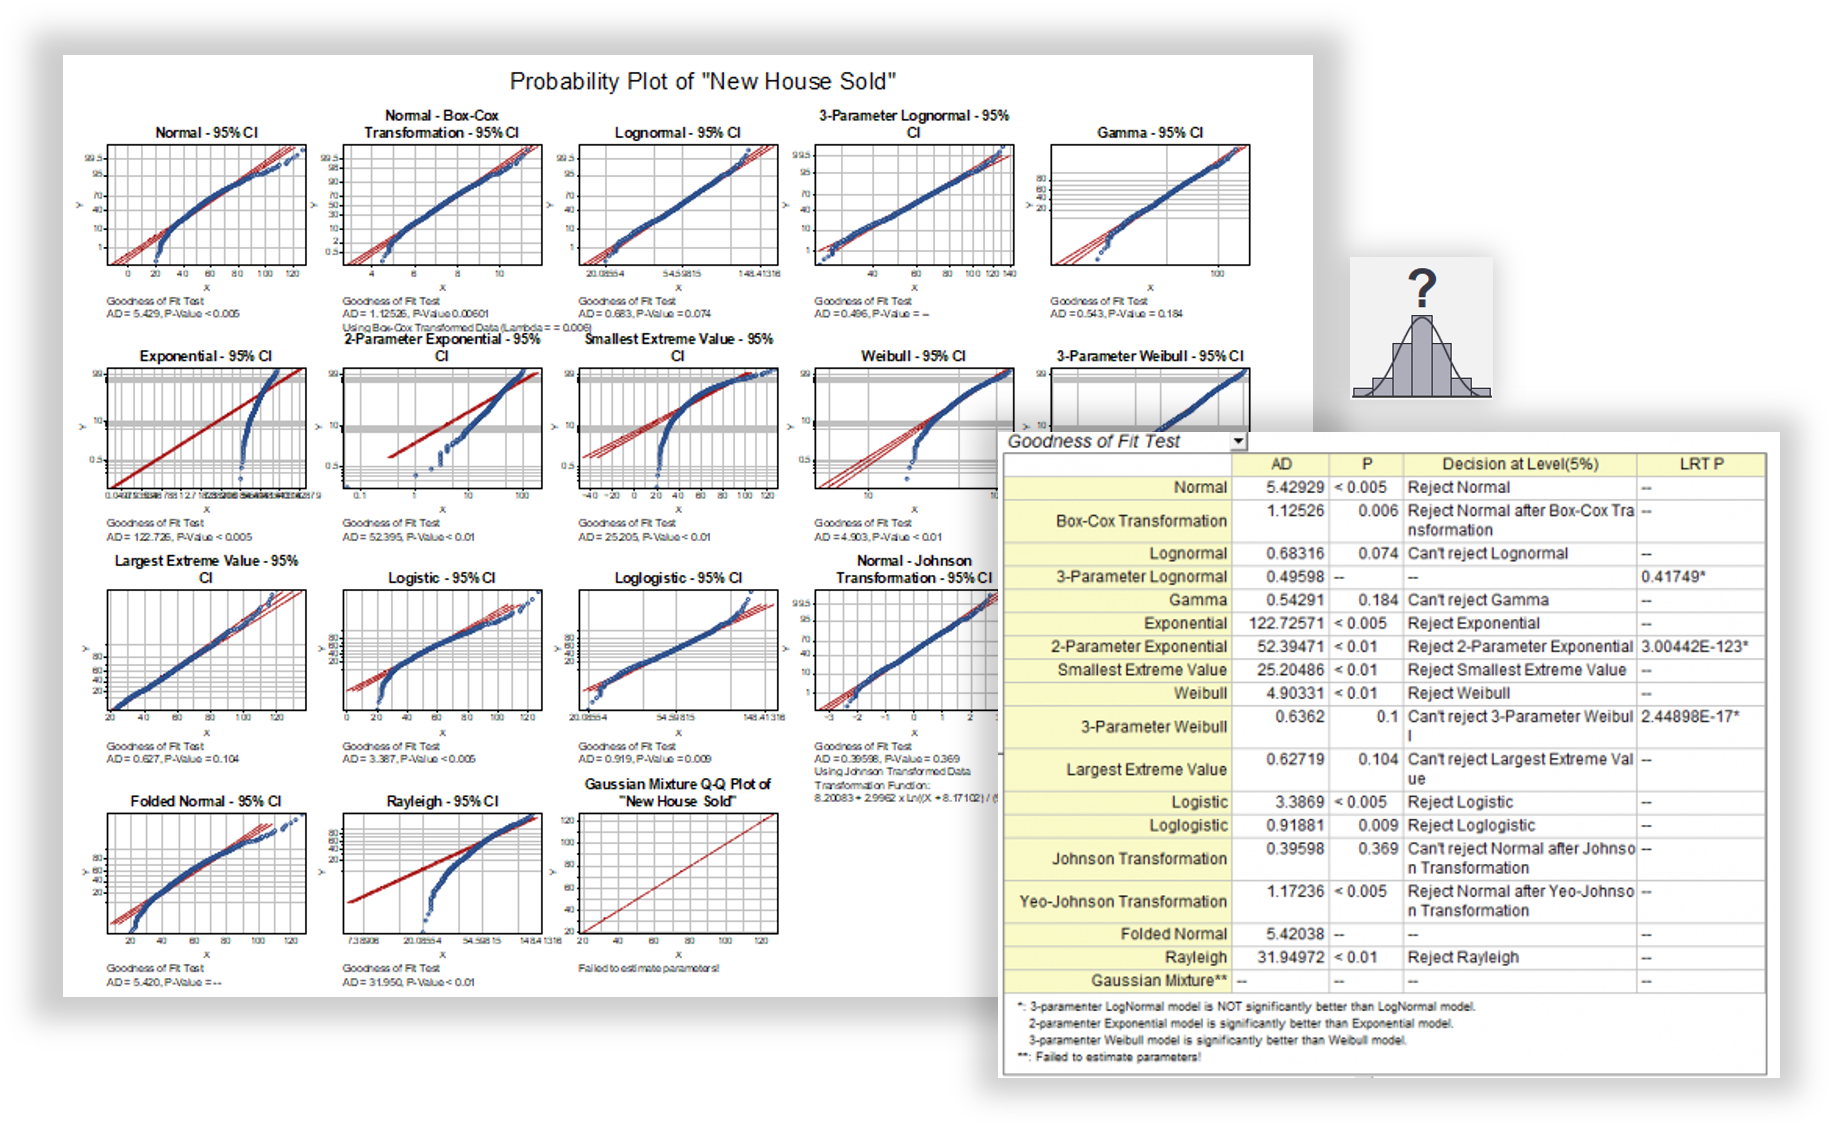
Origin provides 14 distributions and 3 transformation functions to help to identify your data distribution
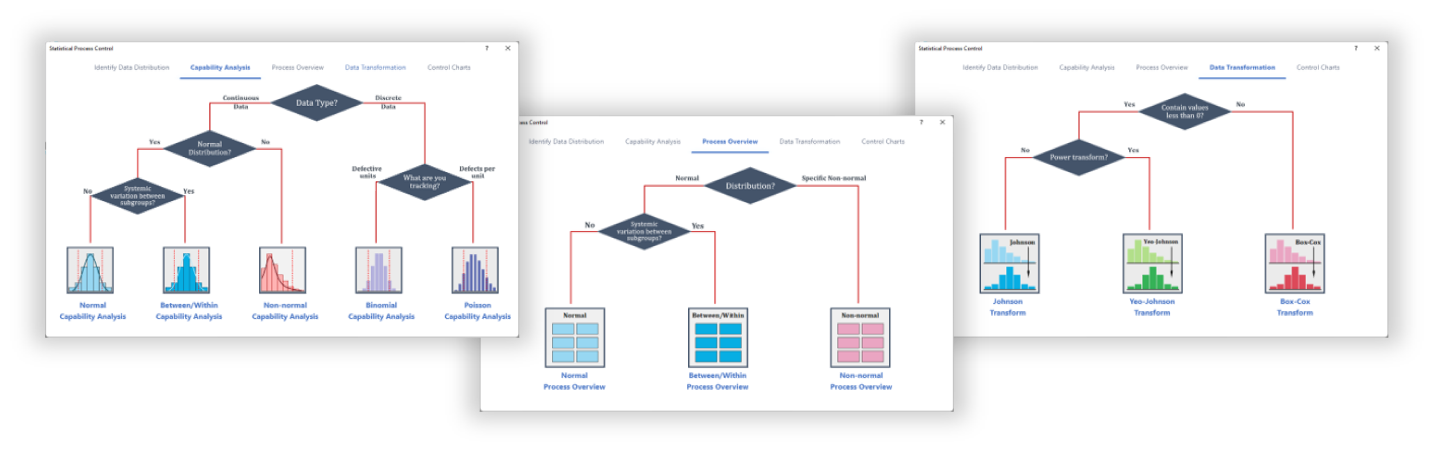
Start from the decision map, choose a proper tool basing on your data type and generate powerful reports.
Measurement System Analysis (MSA)
Origin provides two tools for Measurement System Analysis:

Gage R&R Study
The Gage Study App supports the following features:
- Type 1 Gage Study
- Gage Linear Bias Analysis
- Crossed Gage R&R Study
- Nested Gage R&R Study
- Expanded Gage R&R Study
- Attribute Gage Study
- Create Gage Worksheet
Attribute Agreement Analysis
The Attribute Agreement Analysis App is designed to assess the degree of agreement between appraisers' ratings and known standards. This App supports the following:
- Kappa Statistics
- Kendall's Coefficient of Concordance
- Within Appraisers Analysis
- All Appraisers vs. Standard Analysis
- Agreement Graphs
- Confidence Intervals
- Misclassification Rates

The results of Gage R&R Study in Origin include a combination report with graphical analysis and a report sheet with ANOVA table, variance components and Gage R&R statistics
Tolerance Intervals
Origin offers Tolerance intervals app, which is important tool in quality control. It helps understand and manage variability in production processes. The tolerance intervals app in Origin provides the following features
- Support multiple distributions
- Normal
- Lognormal
- Gamma
- Exponential
- Smallest Extreme Value
- Weibull
- Largest Extreme Value
- Logistic
- Loglogistic
- Nonparametric
- Parametric and non-parametric tolerance intervals
- Sample size & Maximum Population Percentage in Intervall
- Graphical report including interval plot, histogram and probability plots
Design of Experiments (DOE)
The Design of Experiments (DOE) App for OriginPro enables researchers to walk through each step of the design of experiments process.
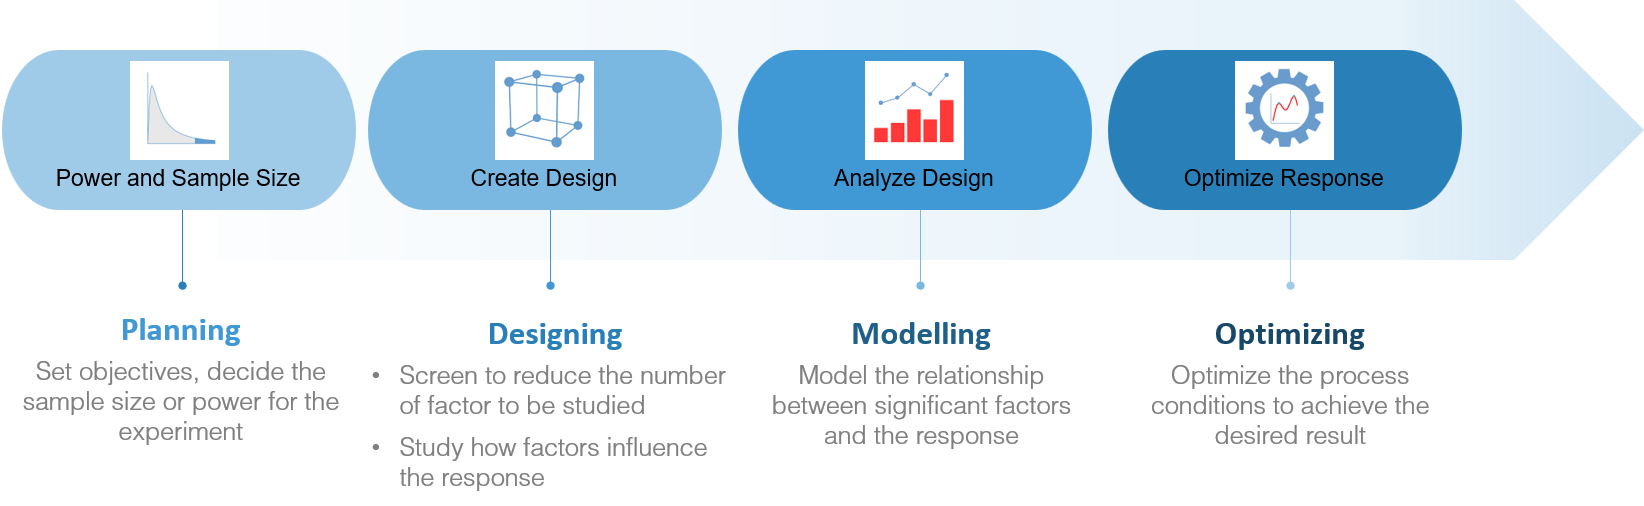
Power and sample size
- Determine the minimum sample size required to achieve a certain level of power for detecting a specified effect size
- Find the right balance that ensures robust and valid experimental outcomes
Design
- Definitive screening design
- Factorial design, including 2-level factorial, Plackett-Burman and general full factorial
- Response surface design, including central composite and Box-Behnken
- Mixture design
Analysis
- Design evaluation tools including coefficients, standard error and p-value
- Build models with linear+interaction+square, or customize terms in regression model
- Analyze design with stepwise
- Statistics table to examine the goodness-of-fit, and analysis summary with ANOVA
- Fits and residual diagnostics
- Find Y from X to extract fitted data.
- Quick and easy to add terms or remove terms from model
Graphics
- Fitted Plot
- Residual Plot
- Effects Plot
- Main Effects Plot
- 2-way Interaction Plots
- Contour Plot
- Surface Plot
Optimize
- Search for optimal responses based on the goal:minimize, maximize and target.
- Constraint factors to a region or hold at a fixed value.
- Display the optimization plot, in which you can tune factor settings to improve the solution.
- Simultaneously optimize multiple responses, each with a different model
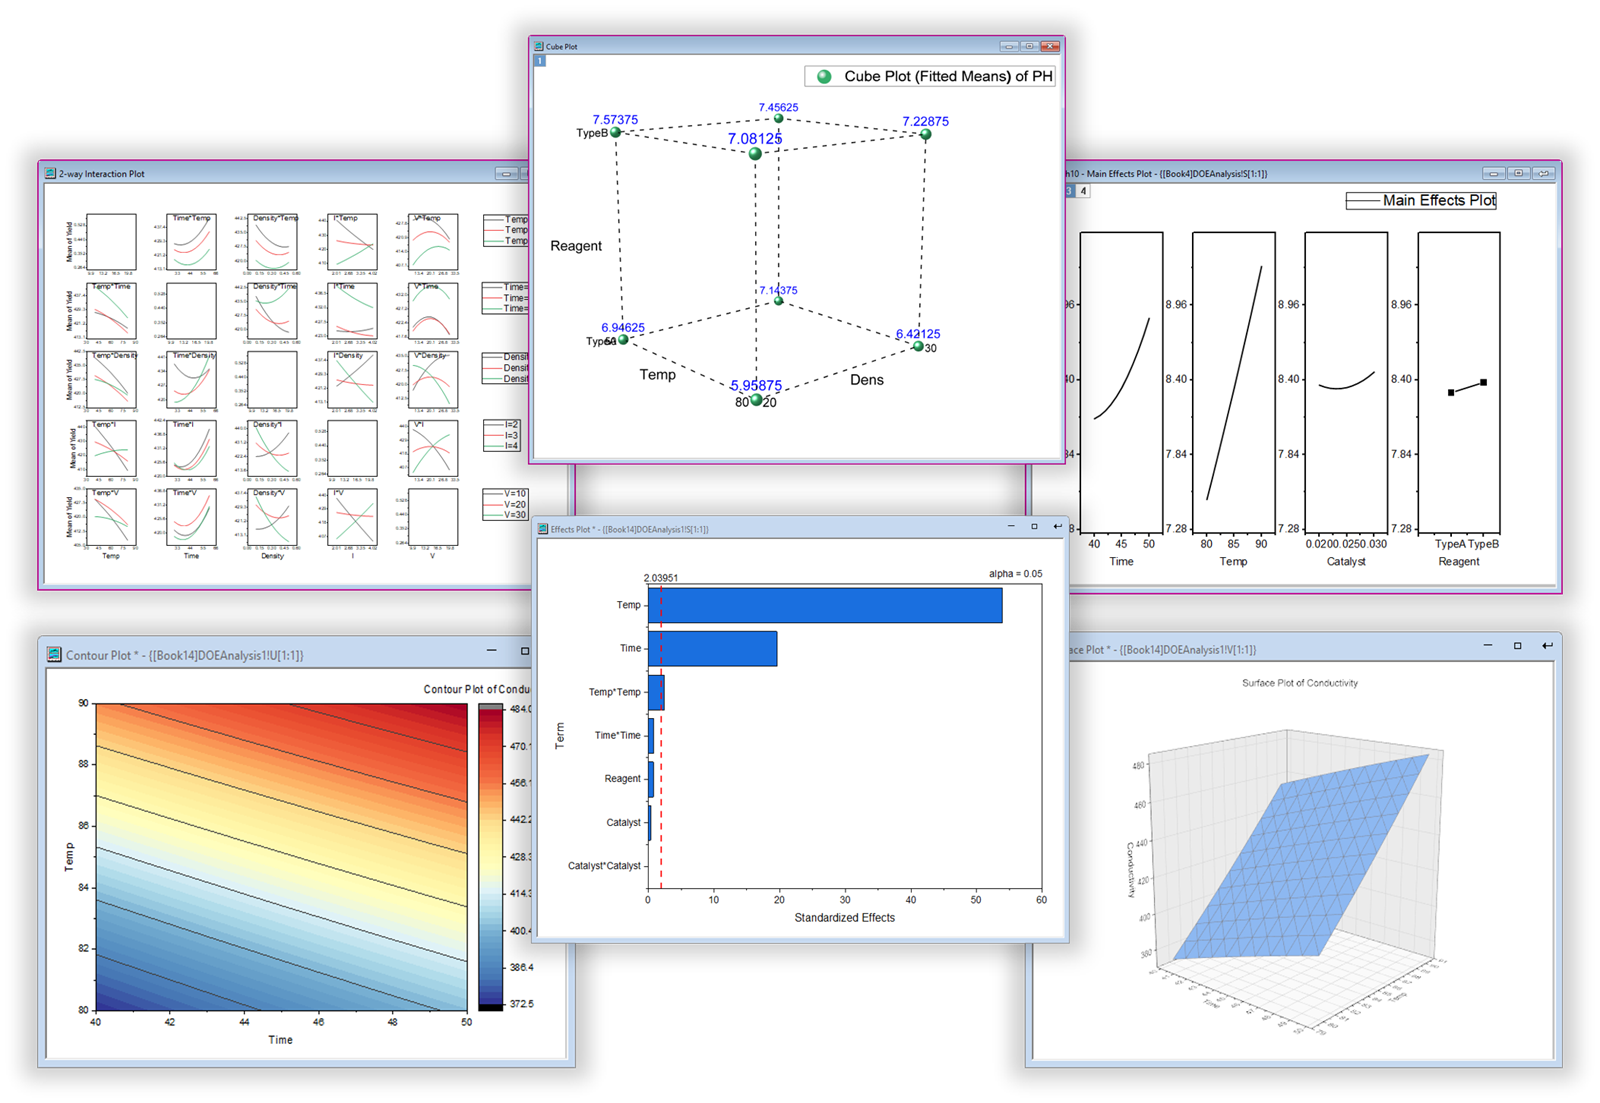
Origin provides various graphs to help you to visualize the results.
Move the vertical red lines to change factor values to view how they affect the composite desirability and the responses in the real time
Statistical Charts
Origin supports many types of graphs which are useful in quality improvement area
- Variability Chart
- Multi-Vari Chart
- Pareto Charts
- Main Effect Plot
- Interaction Plot
- Histograms
- Box Charts/Violin Plots
- Interval Plot
- Run Chart
- Symmetry Plot
- Dot Plot
- Probability Plot
- CDF Plot
- Scatter Matrices
- Time Series Plot
Learn More

The variability chart is a powerful tool to visualize the relationship between factors and a dependent variable. It can graphically display and connect the mean values at each factor level combination
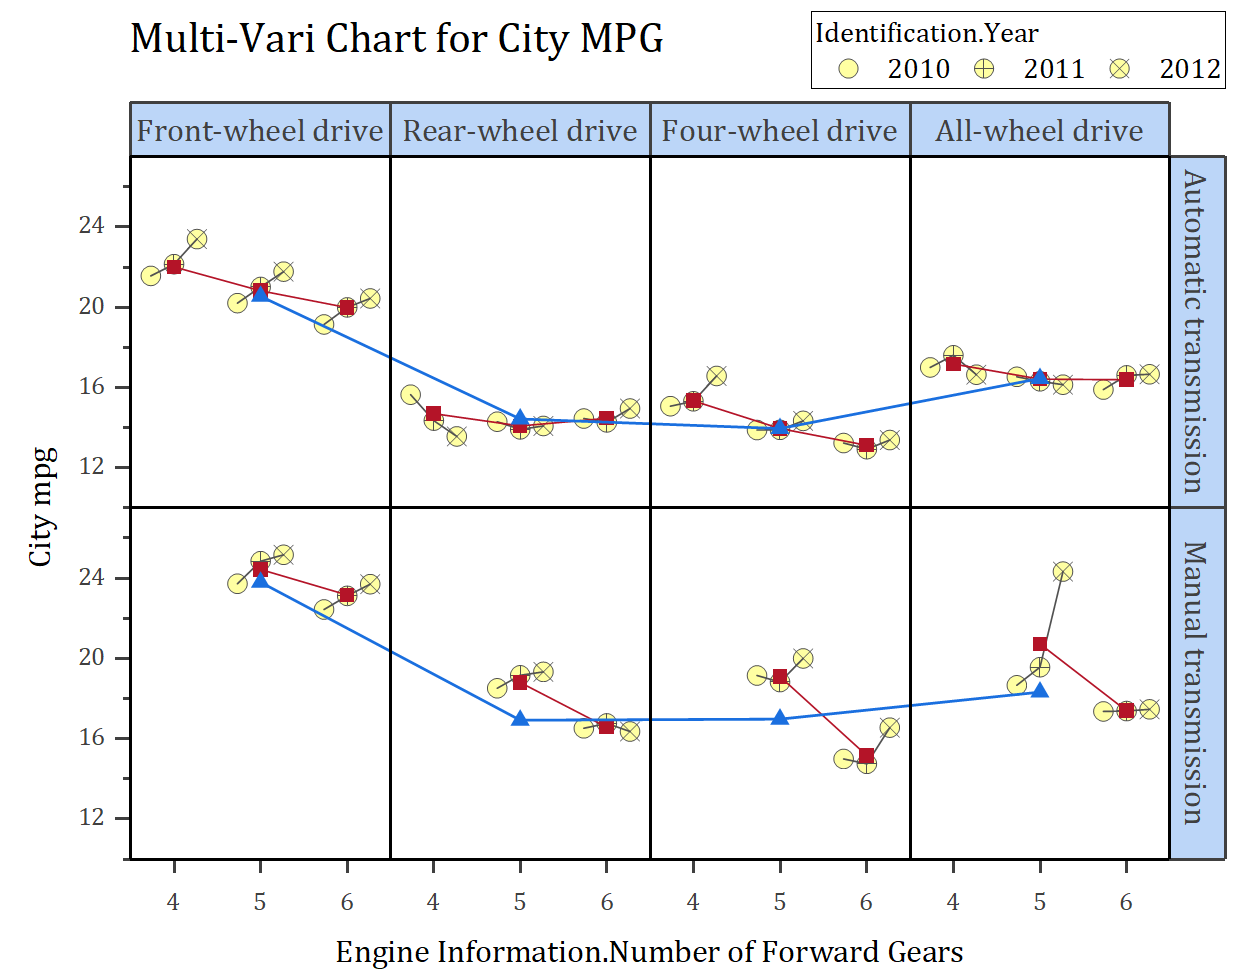
The multi-vari chart is a powerful tool to visualize the relationship between factors and a dependent variable. It graphically displays the mean values across the different levels of each factor.
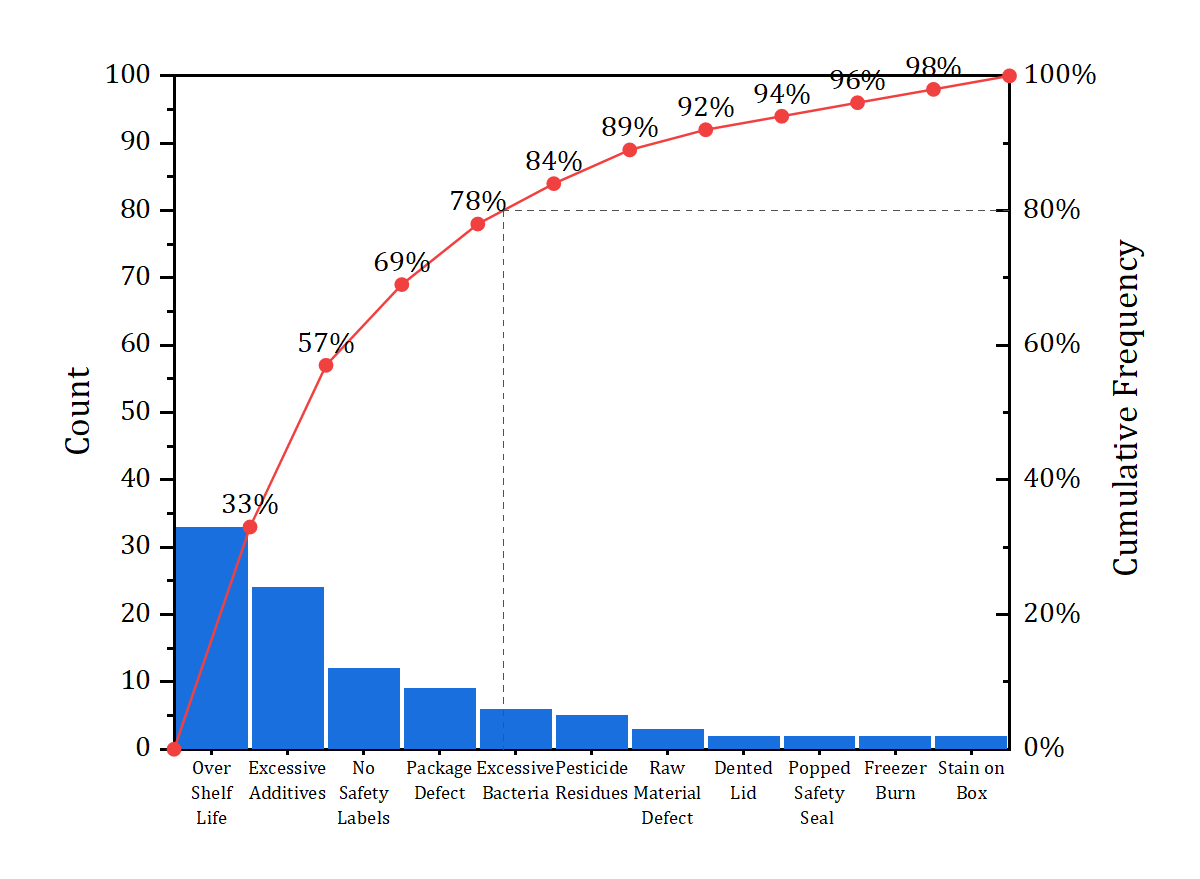
Pareto chart depicting food defects in a sampling test. Origin supports creating pareto chart from raw data or binned data.
Additional Tools
 ANOVA
ANOVA
- One, Two, Three-Way ANOVA
- Repeated Measure ANOVA
- Means Comparison / Post-hoc Tests
- Linear Mixed Effects Models
- One way and Two way MANOVA
Learn More
 Hypothesis Testing
- One, Two, Paired Sample T-Test for Mean
- One, Two Sample Test for Variance
- One , Two Sample Proportion Test
- Power and Sample Size
Learn More
 Multivariate Analysis
- Principal Component Analysis
- Cluster Analysis
- Discriminant Analysis
- Partial Least Square
- Decision Tree Analysis
Learn More
 Regression
- Linear Regression
- General Linear Regression
- Best Subset Selection
- Logistic Regression
- Poisson Regression
- Nonlinear Regression
Learn More
Reliability
- Kaplan-Meier Estimator
- Cox Proportional Hazard Model
- Weibull Fit
- Probit Analysis
Learn More
 Time Series Analysis
- Trend & Decomposition
- Correlation
- Smooth
- ARIMA Model
- Stationary Test
Learn More