Origin 2020b Feature Highlights
How do I get Origin 2020b?
This new version will share the same settings with versions 2018 through 2020. If you have any of those versions, you can simply install and run this new version. No license activation is needed as long as you are eligible for this new version.
New Mini Toolbars for Worksheets and Matrixsheets
- Quick access to common operations on cell, column, row and worksheet
- Toggle display of cell formula, categorical index, column list view, or worksheet organizer
- Toggle matrix view, image slider, or X/Y coordinates
- Mask selected data range or copy to paste into a graph
- Customize Mini Toolbars by adding/removing buttons
Mini Toolbar Additions for Graphs
New Mini toolbar buttons have been added for graphs:
- Fit page to layers, and window view toggle
- Show, hide, add plots in layer, and rescale to show all
- Add Statistics Reference Lines for plots in layer
- Wrap Text button for label, legend, axis title and tick labels
- More axis break customizations such as style, length, etc.
- More buttons for plot types, such as fill area for area plot
- Single point and single label customization
- Graphic object and multi-object customization
- More options in Mini Axis dialogs
- Customize Mini Toolbars by adding or removing buttons
Browser Graph for Multichannel Data Exploration
This version introduces a set of Browser Graph templates that allow for quick and easy exploration of multi-column data:
- Allow quick selection of columns to plot, such as by picking every Nth column
- Choice of line and histogram plots
- Interactively turn selected plots on/off to explore
- Sort plots using any metadata value
- Options to add data from current sheet or other sheets or books
Data Connector Improvements
Several additons and improvements have been implemented for Data Connectors in this version:
- Data Navigator panel added to worksheet to view and change subset of data to be imported, for instance when importing multi-sheet Excel files
- Improvements to CSV Connector for auto-detecting date/time and data blocks
- New Database Connector dialog allows use of connection string, an existing ODBC datasource, a custom ODBC connection w/o datasource or an OLE DB connection
- Improved MATLABTM, HDF and NetCDF Data Connectors
- Several new connectors for other file formats (Please see Apps section below)
Improved Graph Customization
Several new options and improvements have been added for graph customization in this version:
- Copy data for plotting Mini Toolbar button
- Wrap Text in Legend, Axis Title, Text Labels
- Curve Tool for creating editable freehand curved objects
- Droplines at given row or X values
- Connected line, symbol and dropline in 2D and 3D column/bar plot
- Data Highlighting in 3D graph
- Box chart improvements
- Middle level control in 3-color mixing of Colormap
- Reverse plots in layer in Object Manager
- More axis break styles
- Skew Plots with adjusted Angles between Axes
- Symmetrical Positive and Negative Log Scale
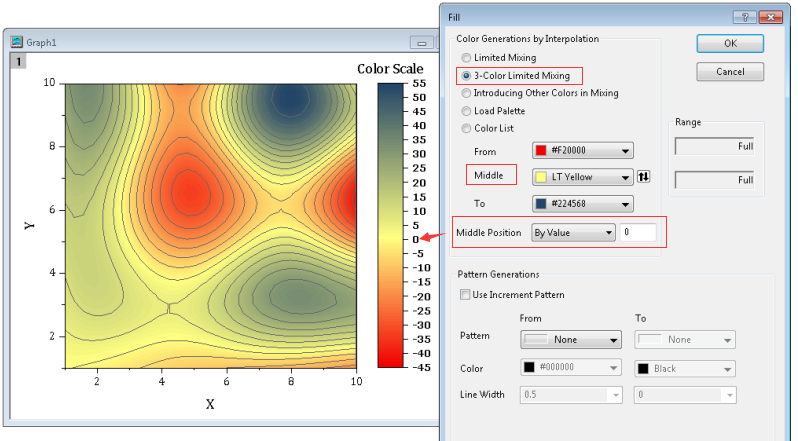
Three color mixing for colormaps with specific middle position value
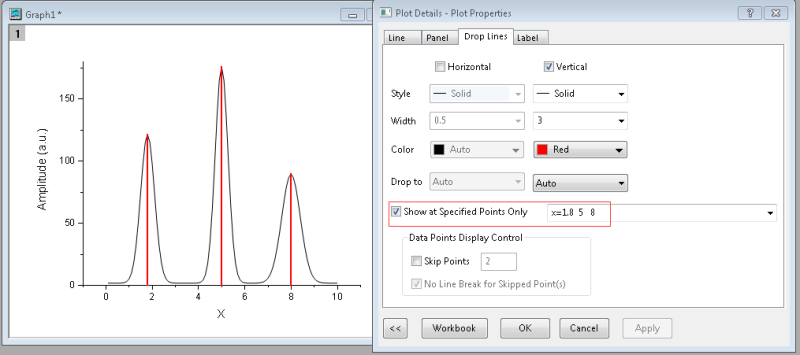
Add drop lines at specific index or x values
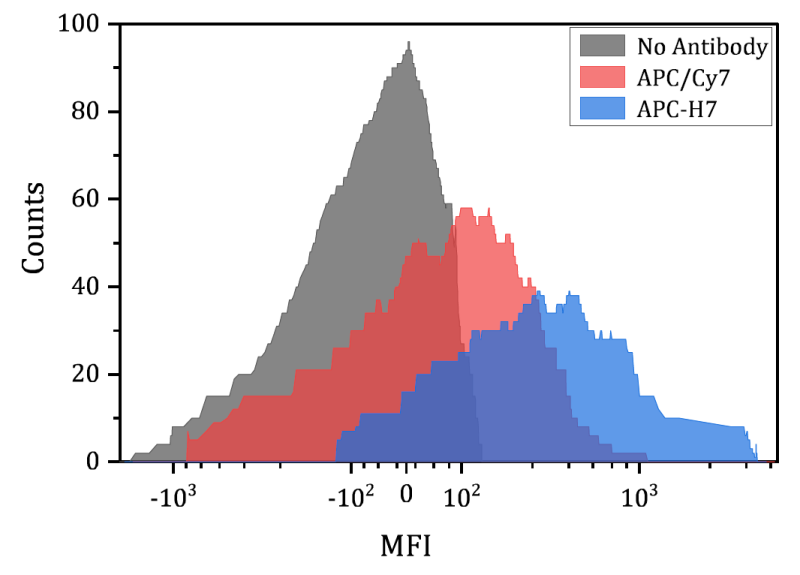
Positive and Negative Symmetrical Log Scale
Multiple options for axis break in Mini Toolbar
New Graph Types
The following new graph types have been added in this version:
- Bland-Altman Plot
- Beeswarm Plot
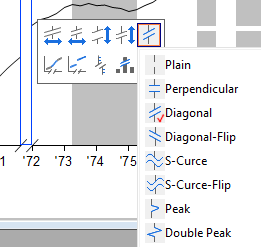
- Radial Lines and Bars
- Bullet Chart: Vertical, Horizontal and Normalized
- Streamline Plot
- 3D XYY "Side-by-Side" Bar Chart
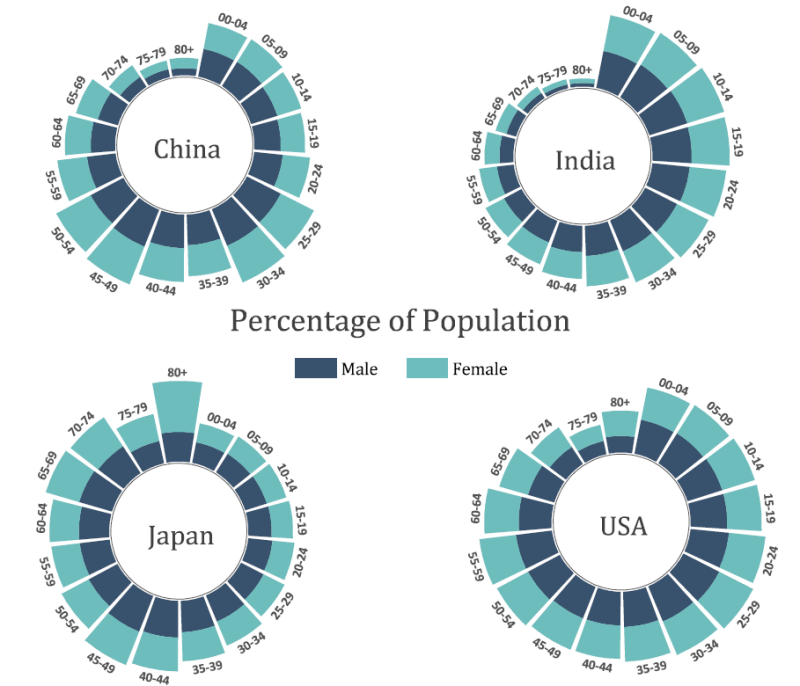
Stacked Radial Bar Chart, also known as Nightingale Rose Chart, or Coxcomb Chart.
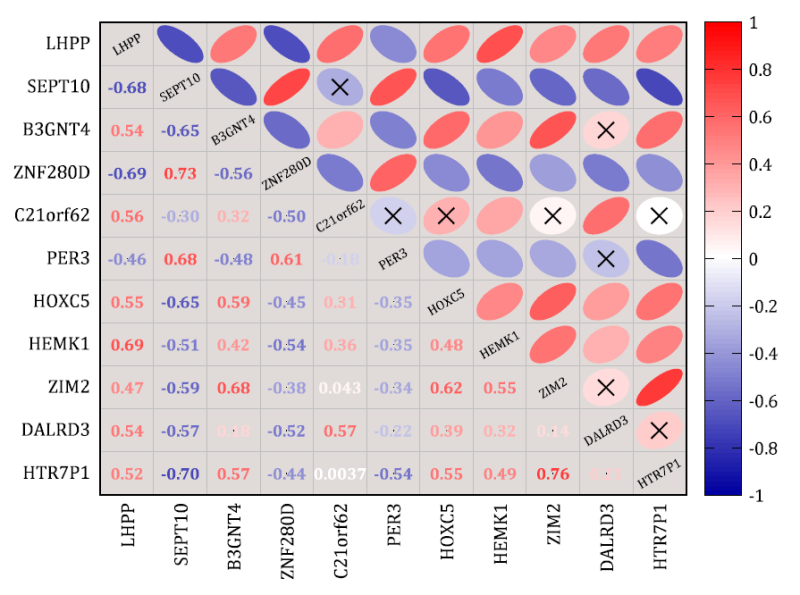
Correlation Plot
The new Correlation Plot App introduced in this version allows several variations to display correlation coefficients:
- Scatter vs. Heatmap vs. Ellipse
- Upper vs Lower Triangular vs Square configuration
- Flexible Labels:
- Significance Mark
- Insignificant Mark
- Correlation Coefficient
- p Value
Correlation Upper Triangular Plot
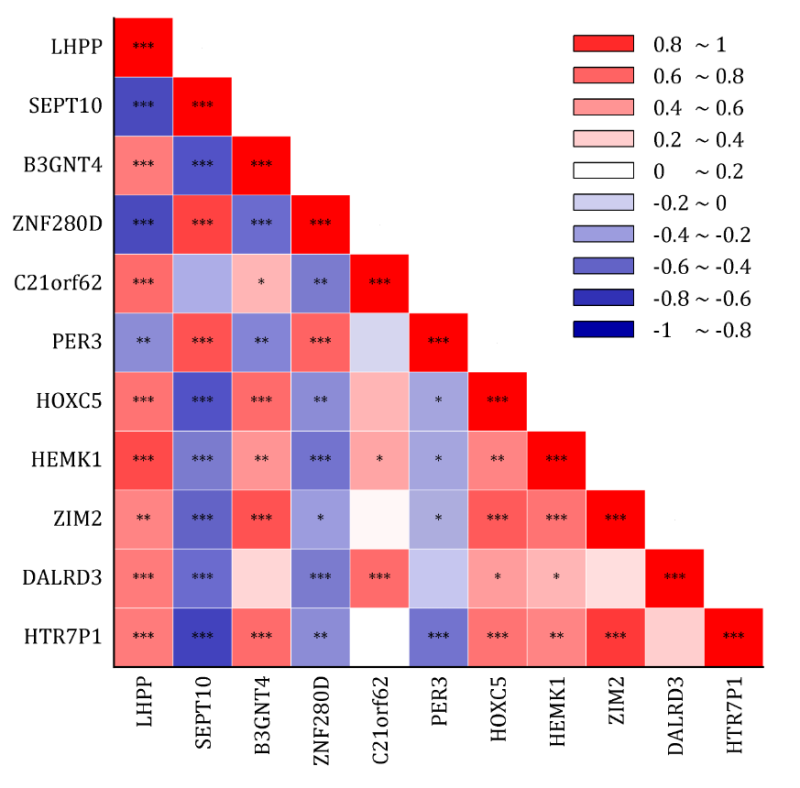
Correlation Lower Triangular Plot
New Apps
The following new Apps are available with this latest version. Several Data Connector Apps that are shipped with the product have also been improved and updated.
Other Features
General
- Better display of cell contents instead of ####
- Allow up to 799 characters in Text cell (increased from 252 in previous versions)
- File: Project Properties dialog to save decimal separator info. in project file
- Change X or Y of plot to column from other worksheet
- Easy way to go to corresponding graph from result sheet
- Allow MATLAB Console to connect to already running instance of MATLAB
- Copy entire hierarchical sheet as HTML
- Copy EMF image in cell and paste into other applications
Data Manipulation
- Text2Cols X-Function to Split Text Cell with separator to Columns
- Remove/Combine Duplicated Rows with multiple reference columns and duplication tolerance
- Split worksheet by reference column value change, direction change and direction reset
- Output Data source in Append worksheets result
- Join Worksheet by Column and Label improvements
- Shrink matrix with more statistics
- Speed up unstacking columns
Analysis
- Peak Analyzer improvements such as filter peaks by script, sort peaks in peak properties sheet, etc.
- Batch PA improvements such as faster speed, recalculation option, sort peaks, better message when fit fails, etc.
- Output Gadget results to source data workbook
- Multiple Dataset Identifier in analysis result
- Reprocess and Update button on Batch Processing summary sheet
- Add EC90 and EC10 output for built-in functions and Sigmoidal gadget
- Statsxy X-Function to get statistics by binning
- Mean Comparison in 3 Nonparametric analysis tools
- Sem() function to calculate standard error of dataset