Origin 2018b Feature Highlights

Am I eligible for Origin 2018b?
This new version will share the same settings from 2017 or 2018, so if you have either installed, then you can simply install and run. No license activation needed as long as you are eligible for 2018b.
Feature Highlights
Workbook and Matrix Preview
Preview of Workbooks and Matrix books is now available in Project Explorer.
Windows File Explore preview is also now supported for Workbook and Matrix books that are saved to disk. For project level preview, if a workbook or matrix book was active at the time of saving the project, then the preview of that window will be used for the project.
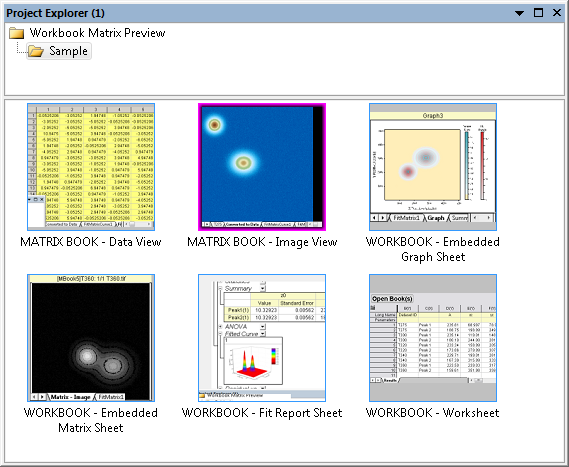
Project Explorer in Origin now supports preview of workbooks and matrices.
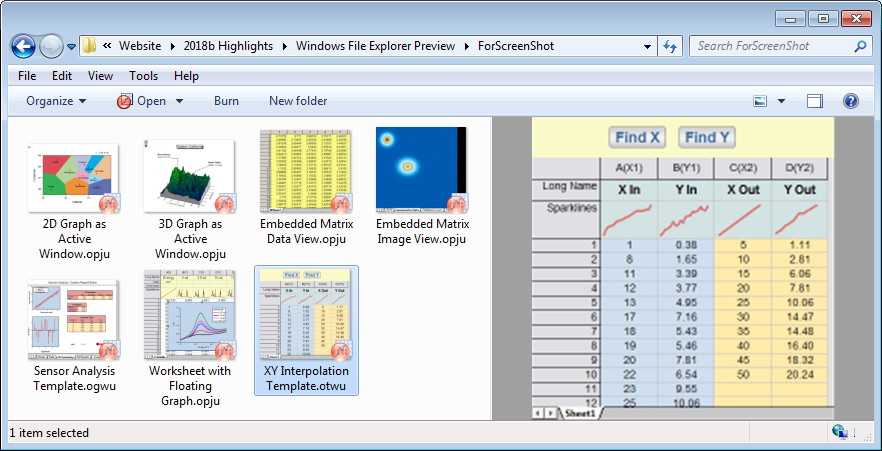
Preview in Windows File Explorer now supports workbook and matrix view, as well as previews for templates based on workbooks and matrices.
Matrix Book as Embedded Worksheet
Embed a multi-sheet matrix window as a sheet in your workbook, along with other relevant worksheets, graphs and analysis results.
Save your workbooks as an Analysis Template™ with the matrix included. The matrix sheets can store input data (e.g. when processing images) and/or output calculations that involve matrices.
Include a multi-sheet matrix book as an embedded sheet in a workbook. Such workbooks can be saved as an Analysis Template™ with the matrix included, allowing you to perform batch analyses that involve both worksheets and matrices, such as those involving image data.
Active Window Indicator
The active window in the Origin interface is now marked by a customizable indicator for easy identification.
The color, style, and thickness of the border line can be set by the user and the indicator can be drawn outside the window, or just around the window title frame.
Enhanced Master Page
The Master Page feature allows you to apply common elements such as company logos and date stamps, to all graphs in your project.
Several enhancements have been made to the Master Page in this version:
- File: New: Master Page menu item for easy access
- Improved sample template with logo and string registers for date stamp, user name etc.
- Button rotates template between Landscape and Portrait modes
- Button to apply master page size to all project graphs with the same aspect ratio
- Option to save settings as default template for future projects
Give your published graphs a consistent look using a Master Page or System Theme™. In the GIF, we used the Master Page feature to add a company logo and date stamp of identical style and position in graphs
Dynamic Resizing of Preview Windows
Graph previews in analysis dialogs can be dynamically resized in horizontal or vertical directions. This gives you a better view of the data and the results, and allows for better interaction with controls in the preview graph.
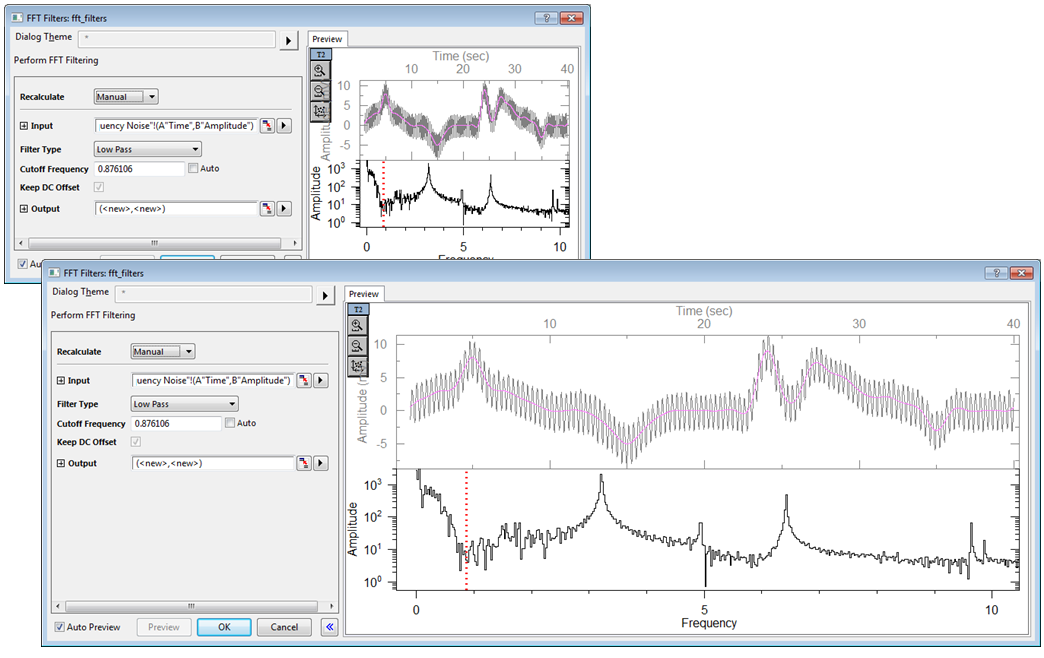
Stretch the graph preview in analysis dialogs either horizontally or vertically for better view and interaction with your data.
Customize Properties Across Graph Layers
Change object properties of a single graph layer (symbol color, fonts, gridlines, etc.) and automatically apply customizations to other layers in a multi-layer graph.
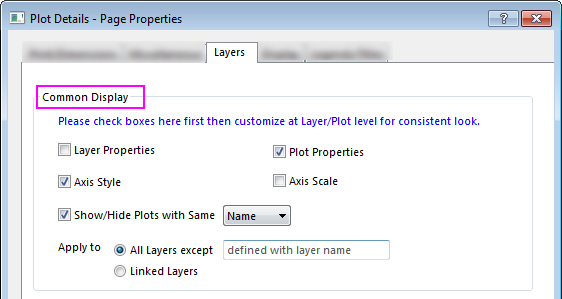
- A new tab at the Page Level in Plot Details contains Common Display controls
- Apply Common Display of Layer, Plot, Axis Style and/or Axis Scale Properties to select layers
- Enable one-click Showing or Hiding of Plots with Same Name or Plot Index, in Plot Details or Object Manager
- Apply Common Display selections to All Layers in the window, All Layers Except ..., or Linked Layers
- Also works within Scatter Matrices for customizing plots of the same type (scatter plots or on-the-diagonal histograms and box plots)
Automatically apply Layer, Plot, or Axis customizations made to one graph layer, to other layers on the page.
Resize Graph for Publishing
Journals typically require a specific width for the graph image, such as 86 mm for single column and 178 mm for double column. In addition, at the scaled size, they may require text labels to be above a particular font size, and lines to be above a certain thickness.
In this version, we offer the following key features for preparing the Origin graph with the exact width specification:
- Resize graph page by specifying desired width, while maintaining aspect ratio (auto scale height when width is changed)
- Scale all elements on the page when resizing in order to maintain proportional balance in the graph
- Conversely, set element scale to some fixed factor when you want to maintain absolute size of elements
- Fit all graph layers to the available page area using user-specified margins, while maintaining layer relationships, relative size, and object scale
Once the graph has been scaled to the desired width then it can be exported in a vector or raster format for submission to the journal.
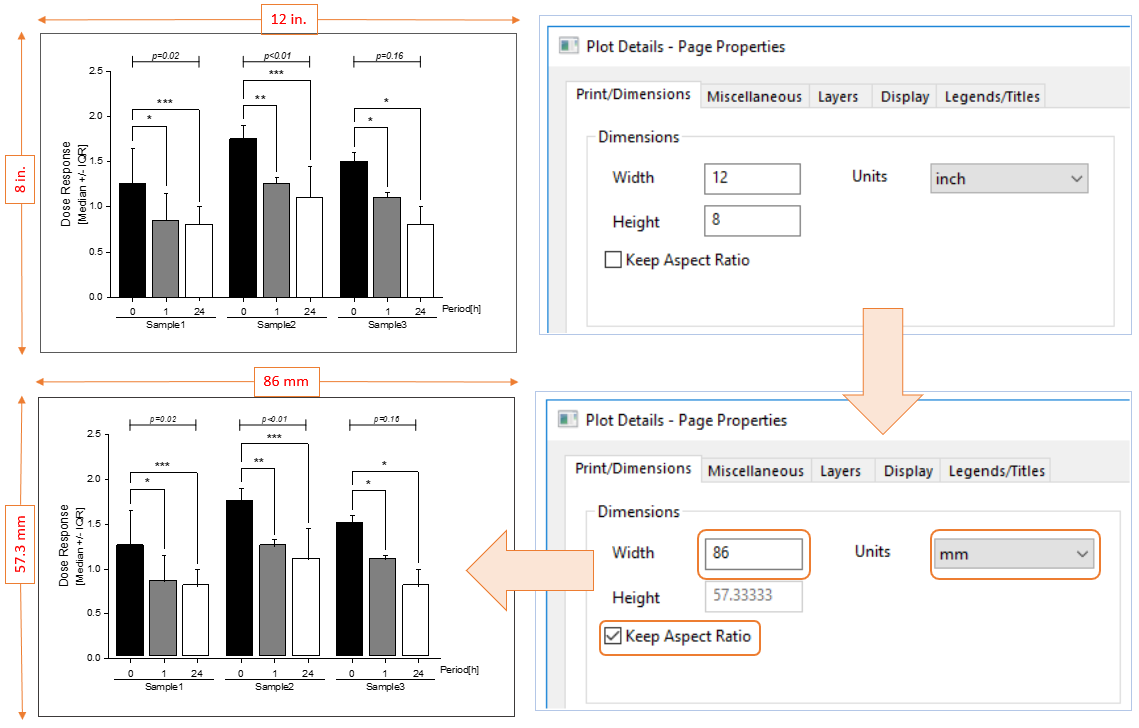
Specify desired width and units to match requirements of the journal. The page height will be proportionally scaled while maintaining aspect ratio. Relative dimensions of all objects in graph will be maintained.
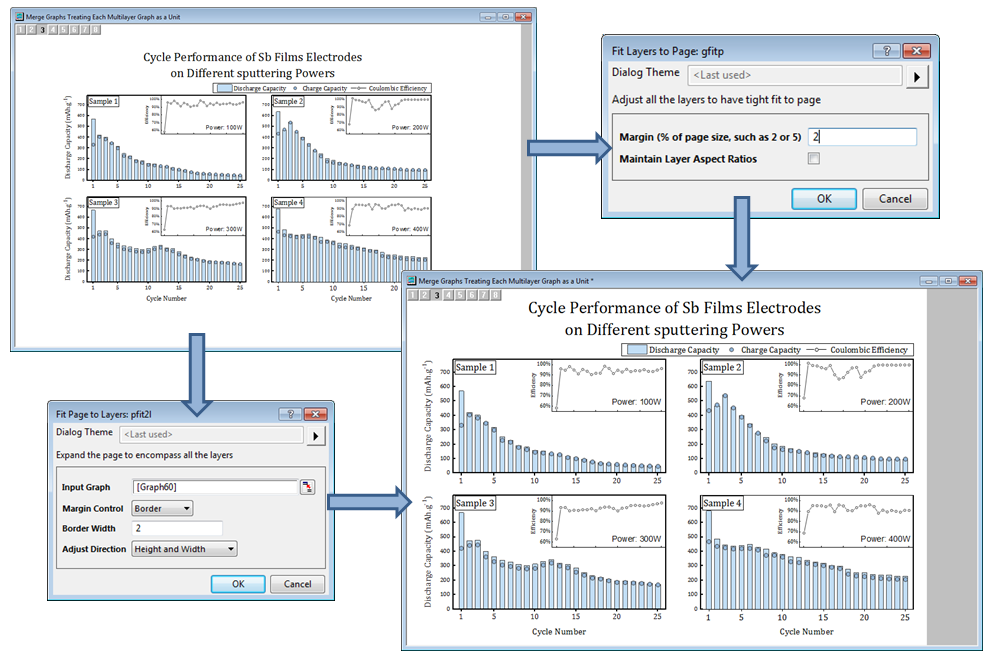
Reduce white space in your graph page by either expanding all layers to occupy available space (Fit Layers to Page) or by reducing page size (Fit Page to Layers).
Enhanced Custom Formatting
More options have been added to Custom Formats for worksheet columns and axis labels, such as "degrees, minutes, seconds (DMS)", and for displaying fractions, percents, etc.
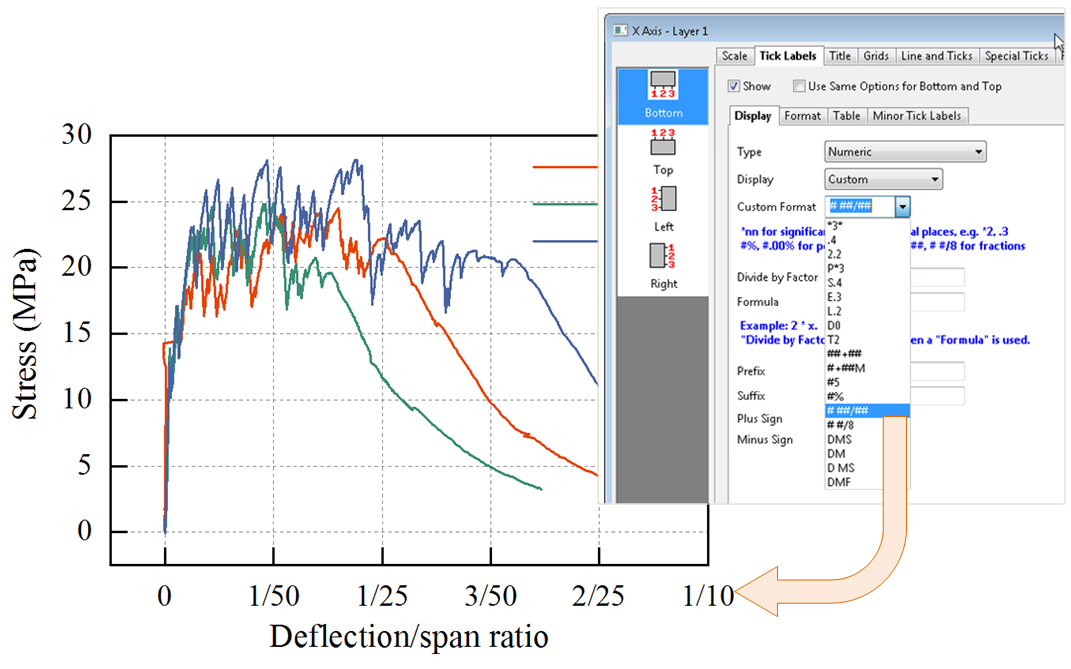
Custom formatting of axis label to display as fraction.
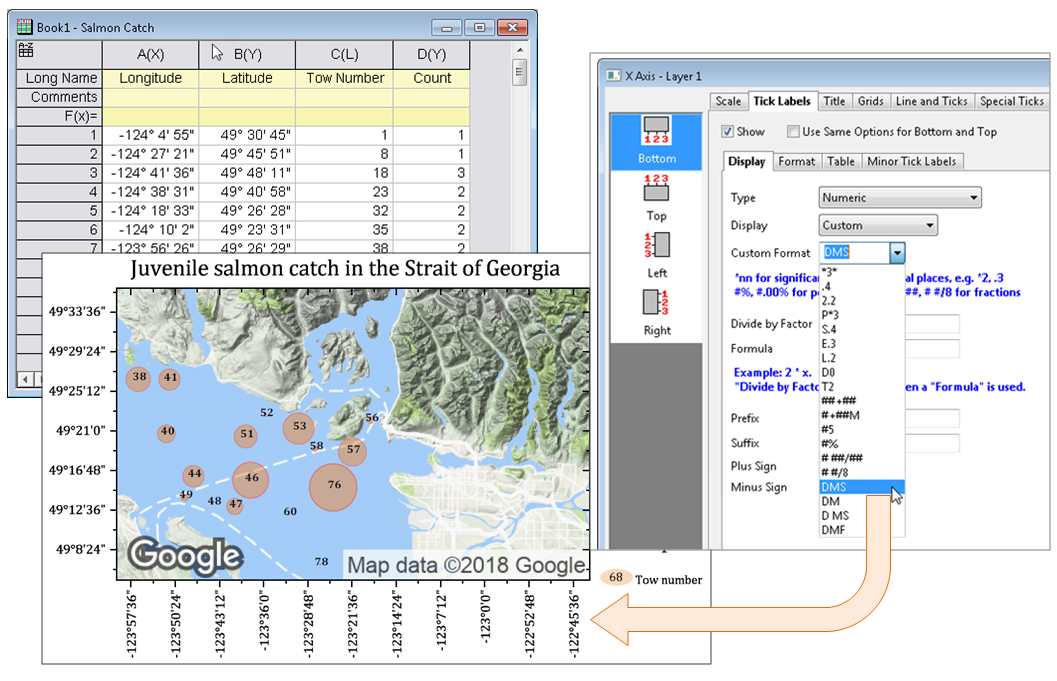
Worksheet cells and axes labels set to custom format for displaying degrees, minutes and seconds.
Exclude Sheets from Plotting
Do your project files typically contain a large number of workbooks and worksheets? Tag "unwanted" sheets with "Exclude from Plotting Dialogs". Then the datasets in those sheets will not be displayed in Layer Contents, Plot Setup or other dialogs that list all available datasets.
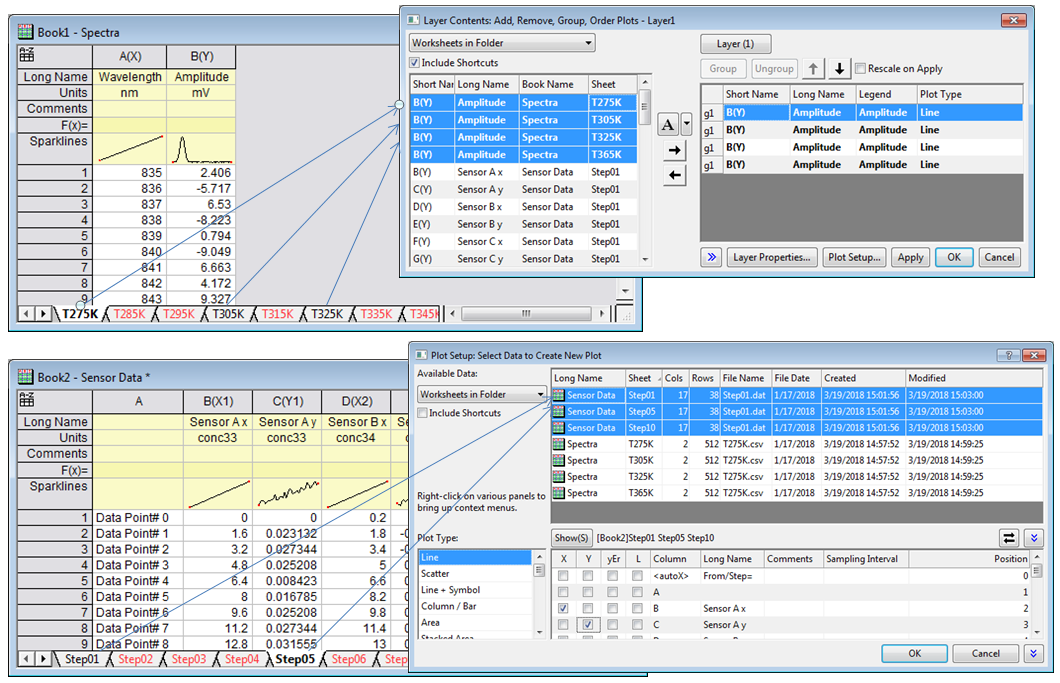
Mark unwanted sheets as "Exclude from Plotting" to reduce the list of available datasets in dialogs such as Plot Setup and Layer Contents.
Improved Audit Log
Turn on automatic addition of audit log for all newly created projects, for consistent management of projects within a group.
Individual Backup Files
Each project will have its own backup file for recovery from such things as a power failure.
Distributed Batch Processing
A Distributed Batch Processing App is available for 2018b.
With this App, you can:
- Start with an Analysis Template that includes desired summary sheet
- Select multiple files
- Specify multiple cores up to the maximum available cores on your PC
- The files get distributed to multiple instances of Origin running on each core
- Let the batch process run in the background so you can continue with other work in Origin
- Check on progress at any time by re-launching the App
- Once all files are processed, generate a consolidated summary table for all files
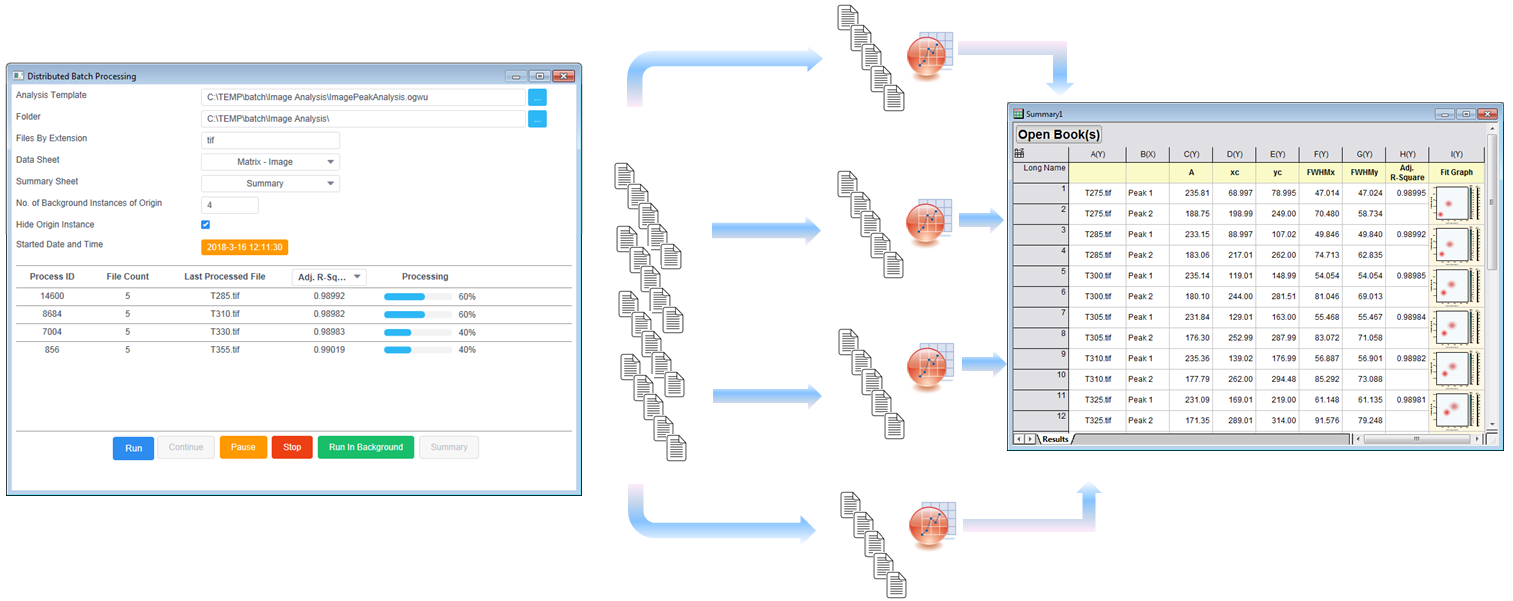
The Distributed Batch Processing App lets you process multiple data files in parallel. The files are distributed to multiple background instances of Origin over available cores on your PC. When all files are done processing, you can create a consolidated Summary report from the App.
New Apps
- Distributed Batch Processing PRO
- 2D Smoother
- 3D Smoother PRO
- Toolbar Maker
- OPJ Packer
- Chromaticity Diagram
- Voronoi Diagram
- Fit Convolution PRO
- Rank Models PRO
- Factor Analysis PRO
- Dynamic Time Warping PRO
Programming:
- LabTalk: New command to automatically turn on audit log for all projects
- LabTalk: Better support for install and uninstall of files installed by drag-and-drop
- LabTalk: Suppport for export and display of Master Items
- LabTalk: Command to remove or restore dividers
- OriginC: Better default for index in GetParameterResults()
- OriginC: Access to get and set LabTalk properties of Origin Objects
- OriginC: Three new functions for Batch Plotting into an active graph
- OriginC: Added a parameter for specifying the dialog title created by "okoc_folder_browser"
- X-Function: findFiles now supports search of recursive folders
- Python: API for calling Origin from Python installed as a separate application (not Origin's embedded implementation)
Other Graphing Improvements
- Option to place axis title at the beginning/end of axis
- Axis arrow can be positioned outside of layer frame
- Support for bubble line thickness in Bubble Scale
- Allow data point label to be placed above error bar
- Support for English date format such as Aug.4 in Chinese/Japanese version
- Support special points for 3D XYZ bar graph
- Allow displaying reference lines on top of data
- Total label for 3D Stacked Column/Bar Plots
- Support line style customization for vector graph
- Enlarged graph using scale-in tool now supports multiple overlapped layers
- Connect Control in 3D Waterfall which enables smooth waterfall lines
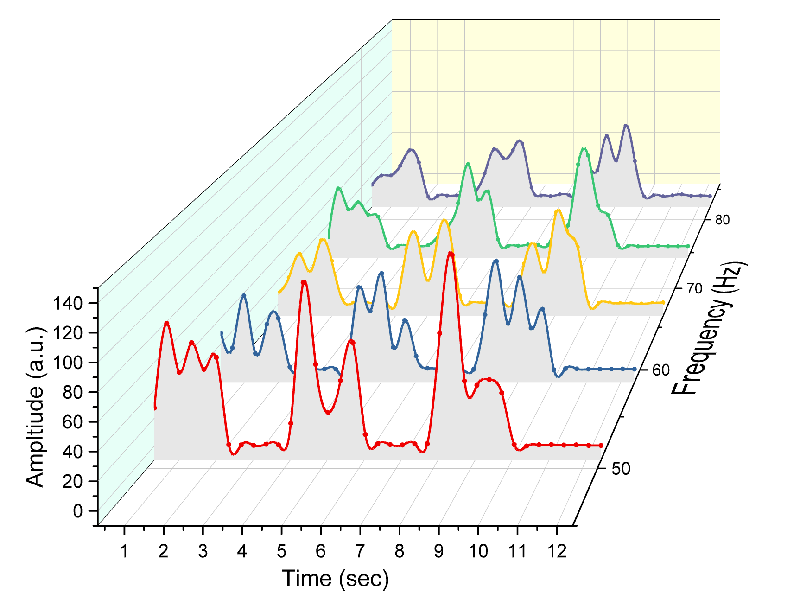
3D Waterfall supports Connect Control which enables watefall to have smooth lines even though data points are few.
Customize special points in 3D Bars such as color and display of data label in this example.
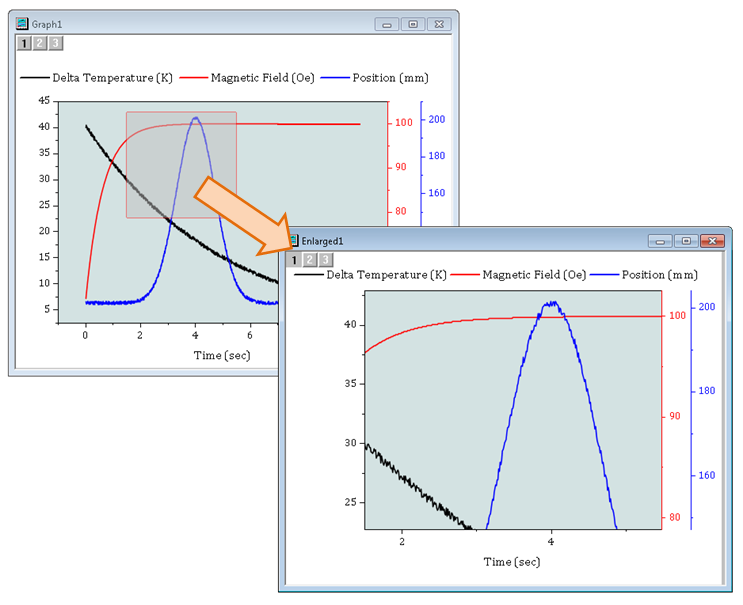
Enlarged graph (use Scale-In tool while holding CTRL key) now supports overlapped multi-layer graphs.
Other Features
General
- Support copy/paste of worksheets across Origin sessions
- Integrate Gadget now supports Fill Area marking under multiple curves
- Batch Processing Dialog settings are automatically saved to the Analysis Template™
- TempSave folder has been put under ProgramData to avoid conflicts with Google Drive
Data Analysis
- Standard error on derived parameters is now included in parameter Summary table
- Two new implicit fitting functions added for diode and solar cell data
- Support for Integral added to Implicit Function for Fitting
- New method for peak detection: Fourier Self Deconvolution
Import and Export
- Option to export multiple graphs as a single multi-page PDF file
- Export graphs with Project Explorer folder name included in export file name
- Added option for starting new rows when importing multiple files in CSV Import
- Significant improvement to speed of MDF Import