User Interface
Origin 2015 introduces MS Office Style Collapsible Menu for some very long menus and context menus so only commonly used ones show by default. Users can access items not frequently used via the double down-arrow at the bottom of the menu.
- Collapsible Menu and Context Menu
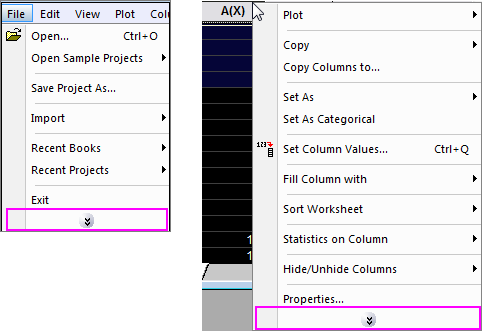
Fig. Collapsible Menu & Context Menu
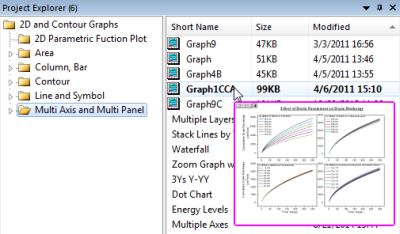
Fig. Graph Preview in Project Explorer
Project Explorer
The Project Explorer in Origin was designed to provide easy control of hierarchy project structures. In Origin 2015 it has been improved with nicer interface and find & search functionality:
- View in Extra Large Icons
- Graph Preview and Tool Tip
- Find String Anywhere in Project
Read More >>
Set Column Values
The Set Column Values dialog is one of the most basic tool in Origin, which is used to carry out column-based calculation with formulas. In 2015 it is highly improved with more intuitive tool tip and function help:
- Search and Insert Functions
- Tool Tip for Function Syntax
Read More >>
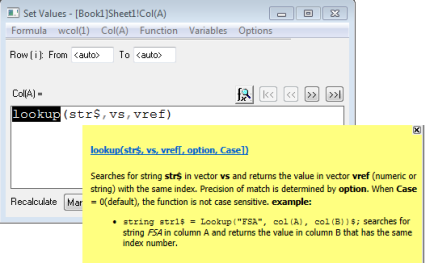
Fig. Function Tool Tip in Set Column Value Dialog
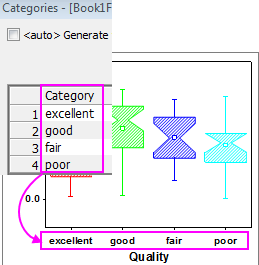
Fig. Using Categories Data to Control Grouped Box Chart
Graphing and Analysis
In Origin 2015, many improvements are targeted to provide easier and user-friendlier control options with both graphing and analysis:
- Colored Pairs of Parentheses in Function Formula
- Batch Plotting in 3D and Contour Graph
Axis Dialog
Axis Dialog has been redesigned with visual icons on the left panel for easy navigation. Meanwhile, more customization options on axis (line, ticks and labels, special ticks) are provided, including wrap tick label.
Read More >>
Bubble Scale
The bubble scale can be shown as nested or linear layout and you have full control on its customization.
Read More >>
Color Scale
Full control with color scale display is provided by the new Color Scale Control dialog.
Read More >>
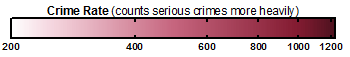
Fig. Color Scale Object with Line and Ticks
Two special legend objects, the legend for categorical values and box legend have been improved with more display and customization options.
Read More >>