OriginPro for Life Science
OriginPro provides an integrated environment for organizing, analyzing, and visualizing life science data. With specialized Structured Tables, context-sensitive analysis tools, and publication-quality graphing, researchers can streamline their workflows from raw data to final results.
OriginPro 2027 further streamlines life science workflows with dedicated Western Blot and qPCR analysis tools, enhanced statistical comparisons, replicate dose-response fitting, and reusable analysis templates for repeated experiments.
Key Benefits:
- Organize experimental data using structured tables.
- Import and analyze data from GraphPad Prism and Excel.
- Streamline Western Blot and qPCR analysis.
- Perform statistical tests and visualize significant differences.
- Analyze dose-response data with advanced fitting tools.
- Generate publication-quality figures with fewer manual steps
- Reusable Analysis and Batch Processing
Blog... >
Transition Easily from GraphPad Prism
Researchers using GraphPad Prism can quickly bring existing data into Origin Structured Tables. No manual restructuring required for many common Prism table formats.
- Import data tables from Prism project files (.prism and .pzfx)
- Copy and paste data directly from Prism
- Preserve common life science data layouts
- Continue analysis using Origin's extensive graphing and statistical tools
- Expand beyond traditional Prism workflows with advanced visualization, automation, and data management capabilities
Organize and Explore Data Around Your Experiment
Structured Tables make it easy to organize data the way experiments are actually performed, instead of forcing information into flat spreadsheets.
Examples:
- Cell viability studies with treatment groups and replicates
- Time-course experiments
- Gene and protein expression studies
- Pharmacology and dose-response assays
- Animal studies with multiple factors
- Omics datasets with annotations and metadata
Keep measurements, experimental conditions, sample information, annotations, and metadata together in one place. View data from different perspectives without manually rearranging worksheets. Compare experimental groups and uncover meaningful patterns while preserving the structure and context of your original dataset.
From data collection through analysis and visualization, Structured Tables help you manage complex datasets, improve traceability and reproducibility, and gain deeper insights from your experiments.
Graph Data Directly from Structured Tables
Explore and Visualize Data
Reveal patterns, trends, and relationships in your data. Graphing tools are designed to work seamlessly with structured datasets, making it easy to move from data exploration to presentation.
Choose from a wide range of workflows:
- Bar and column plots
- Scatter and dot plots
- Box charts
- Violin plots
- Line and time-course plots
- Grouped and multi-factor visualizations
- Heat maps
Customize your figures and save your settings as a template for future use. Compare groups, identify trends, detect outliers, and create publication-ready graphs that help you gain insights and tell the story behind your data.
Visualize Statistical Significance
Create Multiple Comparisons and Significance Plots directly from ANOVA, t-test and nonparametric test reports, with statistical results automatically transferred to the graphs.
- Choose from Bar, Box, Violin, and Scatter plots.
- Display p-values and significance annotations.
- Customize p-values, stars, brackets, and letter-based grouping
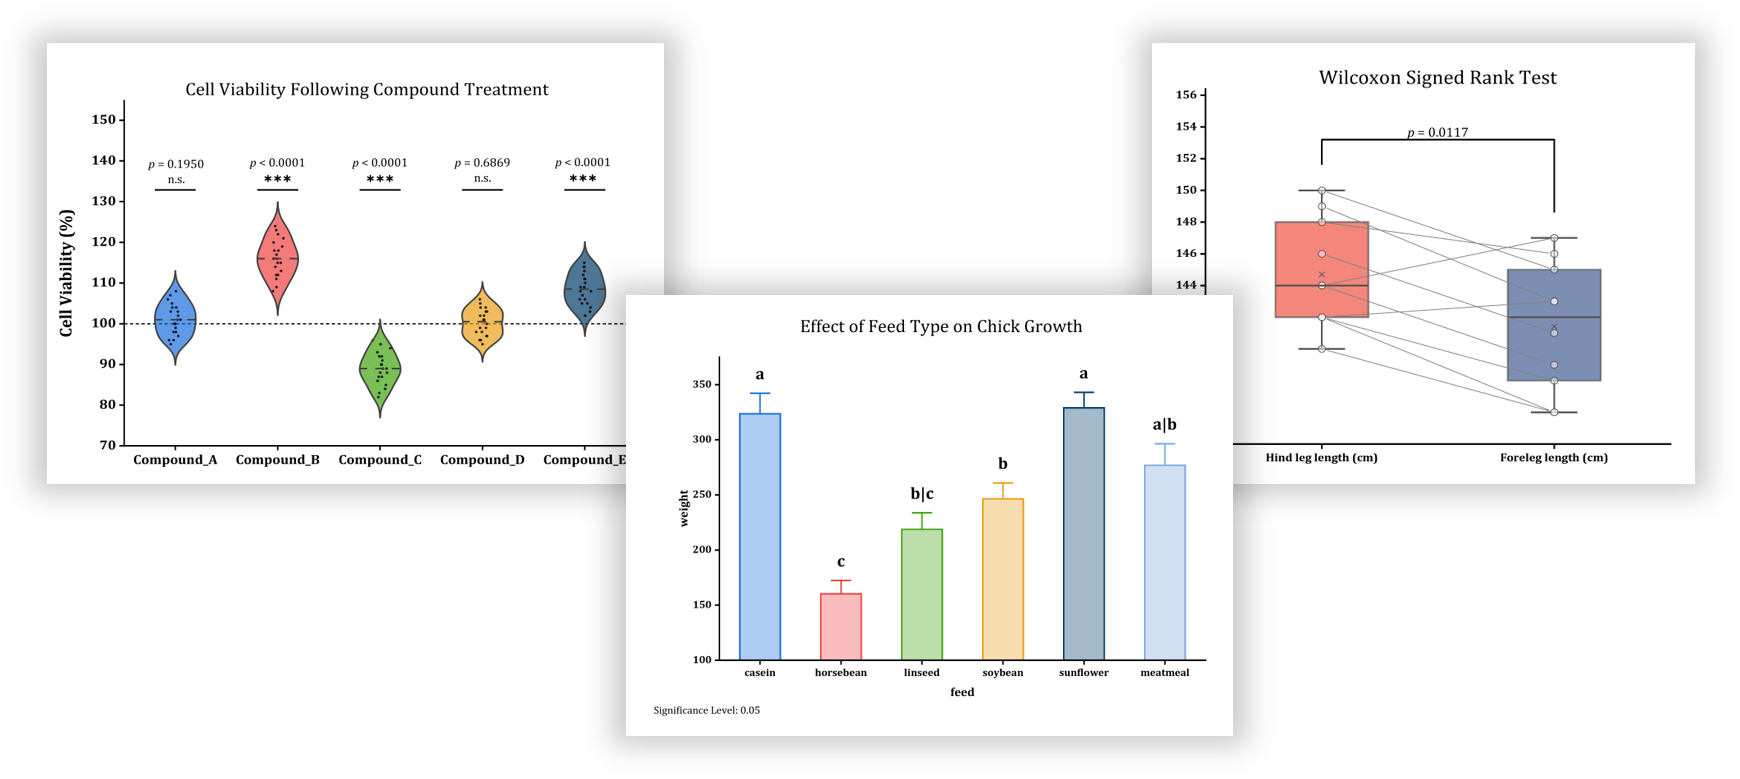
Create Multiple Comparisons and Significance Plots directly from statistical analysis reports, with results automatically transferred to the graphs. Choose from various plot types and customize significance annotations using p-values, stars, brackets, or letter-based grouping.
Statistical Analysis
Perform common life science analyses directly from structured data without manually reorganizing datasets or exporting data to separate statistical software.
Choose from a wide range of statistical methods:
- Descriptive statistics
- t-tests and nonparametric tests
- One-way, two-way, and three-way ANOVA. Repeated measures ANOVA
- Linear regression and correlation analysis
- Cross tabulation and Chi-Square tests
- Survival analysis
Analysis tools automatically recognize the experimental factors, groups, and replicates stored in Structured Tables. Move seamlessly from data organization to statistical analysis and visualization while maintaining complete experimental context, traceability, and reproducibility.
Built-in Conclusion Charts help researchers quickly interpret statistical results and identify significant differences or associations.
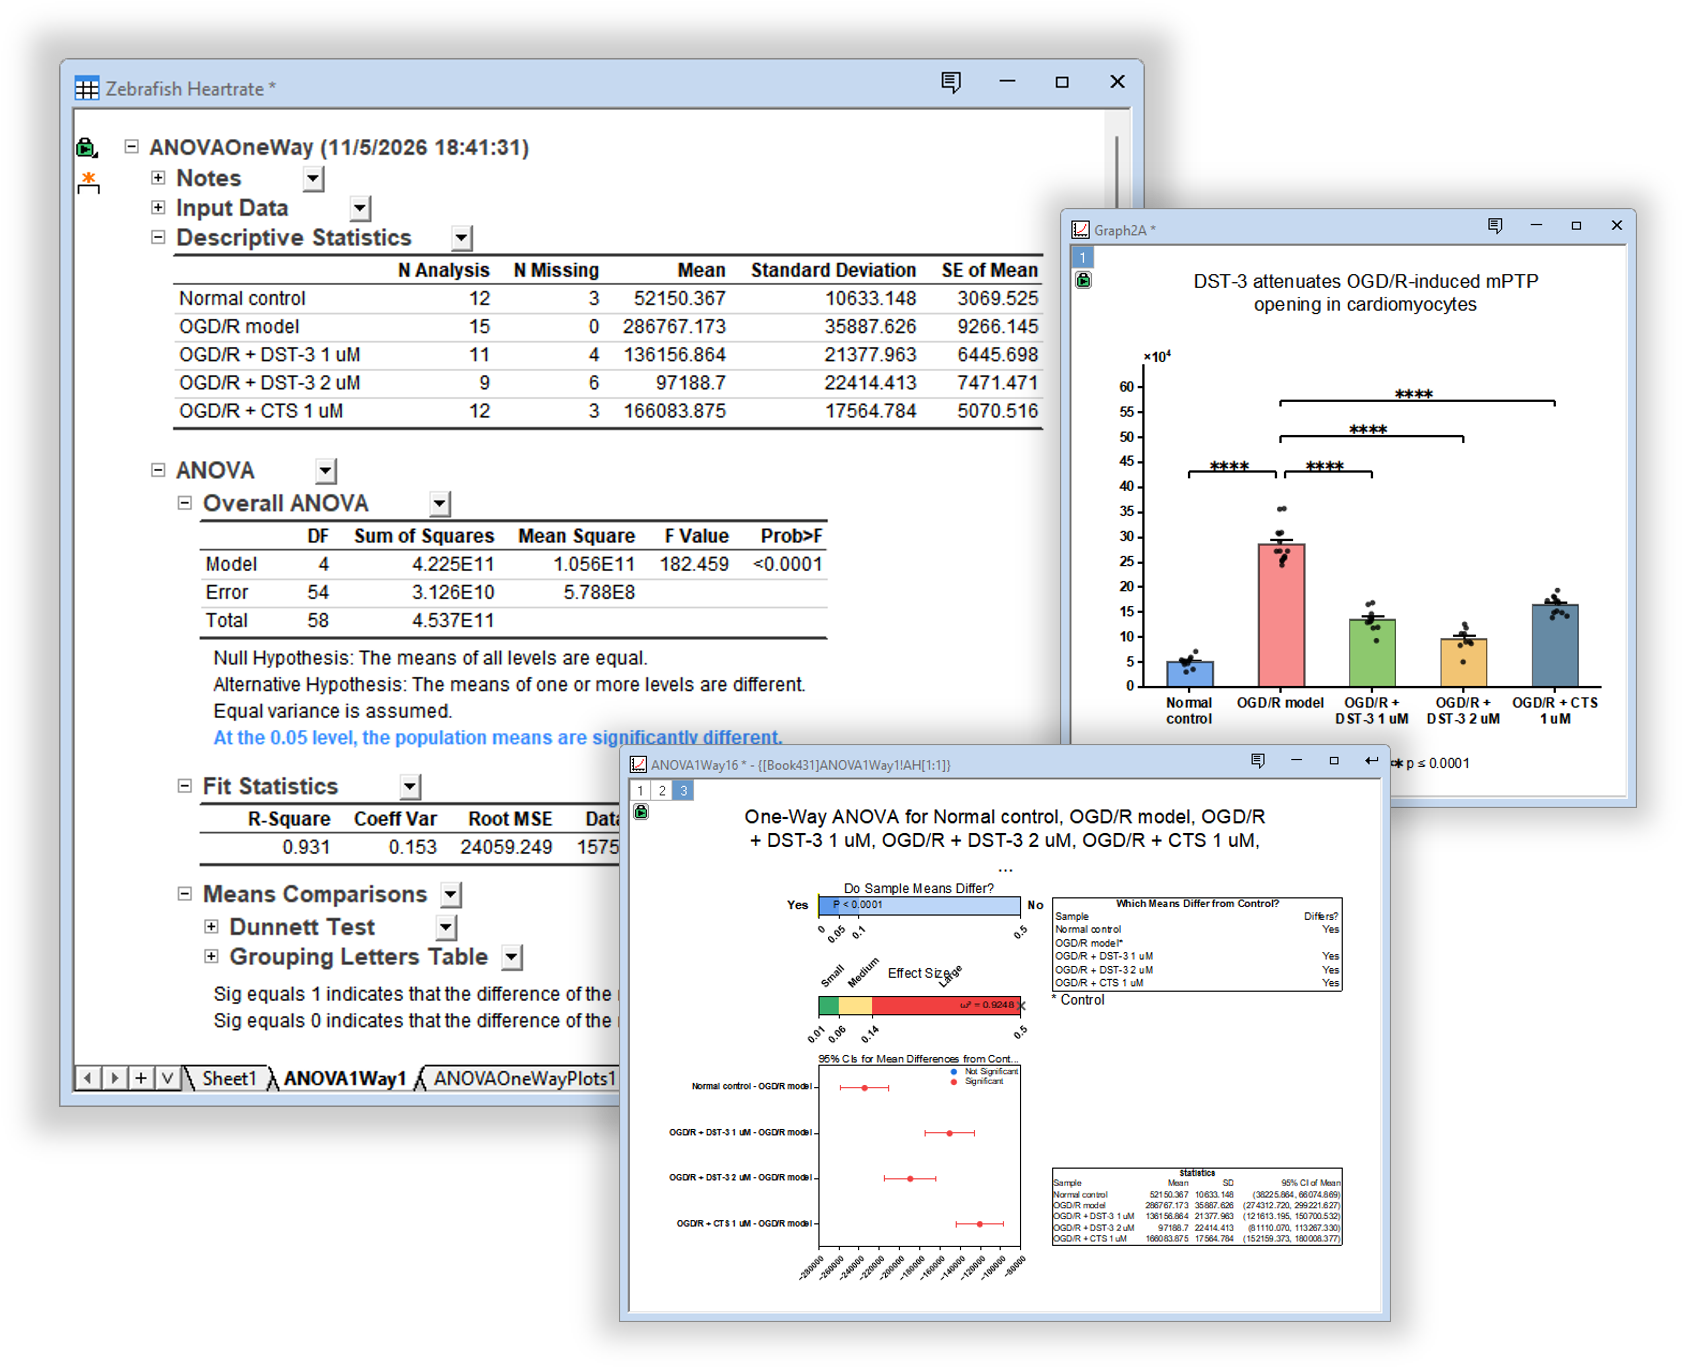
Perform One-Way ANOVA directly from structured data. The analysis report includes a built-in Conclusion Chart and supports creating Multiple Comparisons Plots directly from the statistical results.
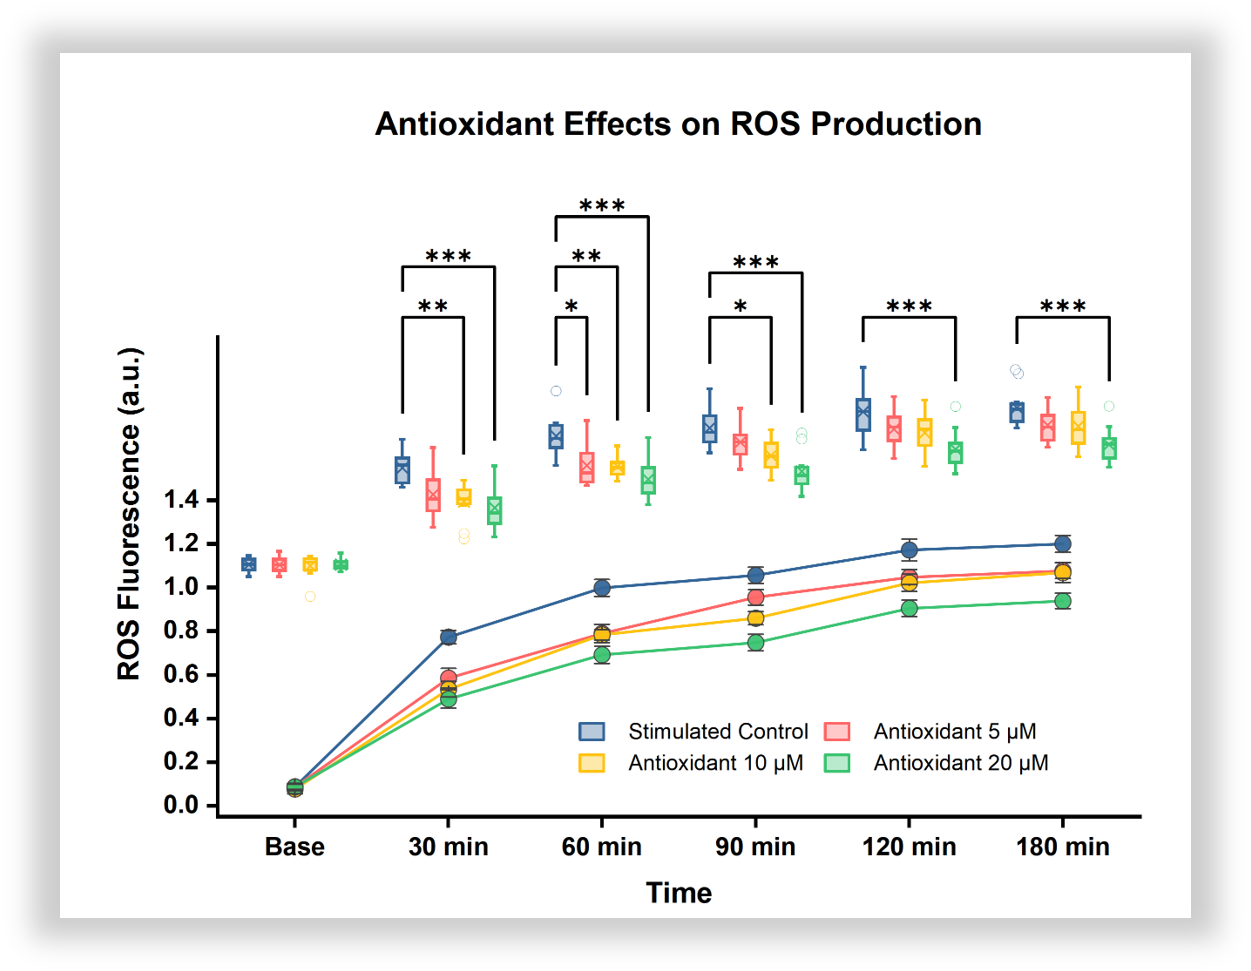
Combine Multiple Comparisons Plots from two-way repeated measures ANOVA with time-course graphs from Structured Tables to visualize treatment effects, data distributions, and statistical significance in a single figure.
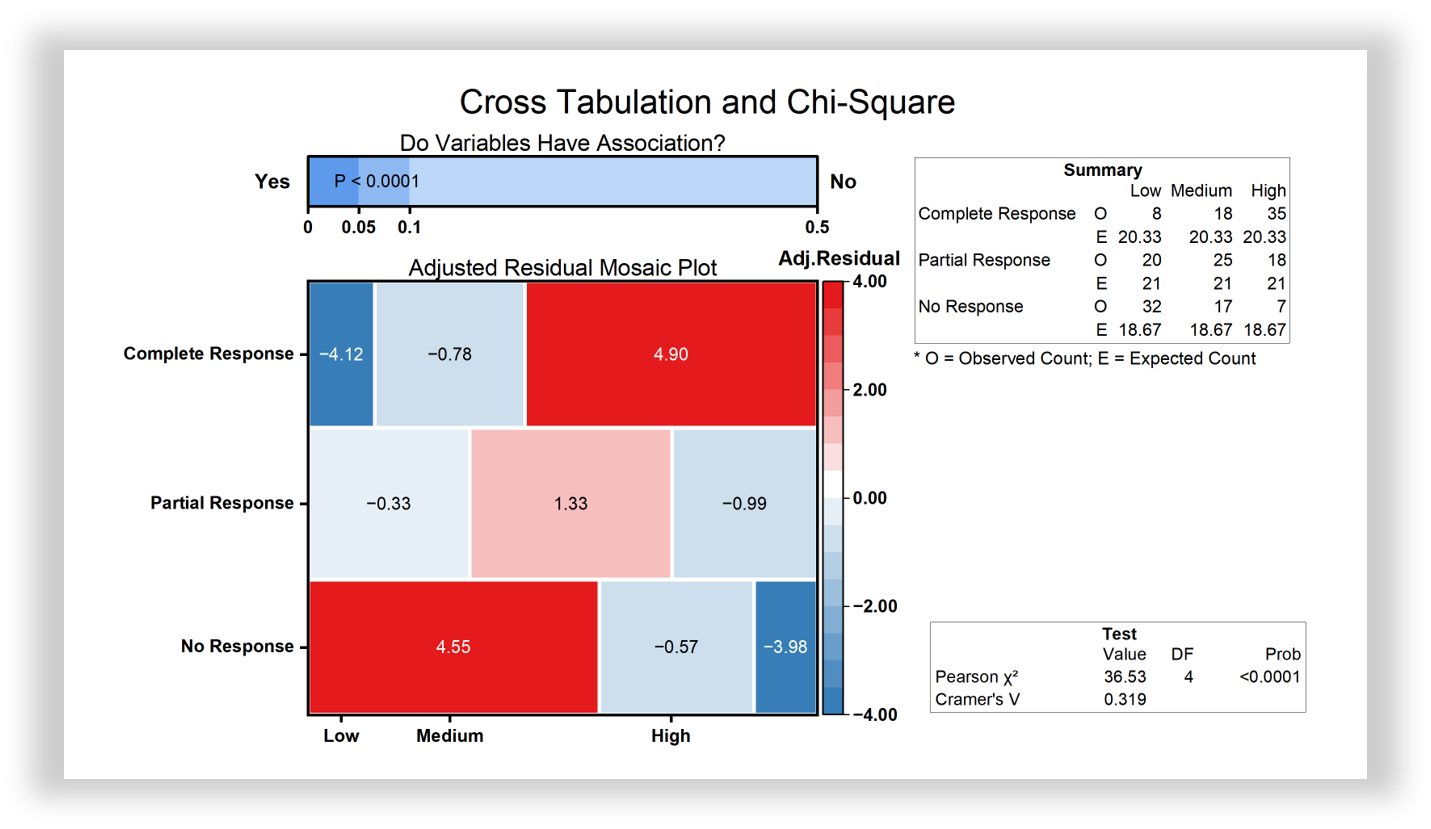
Many of Origin's statistical analysis tools provide built-in Conclusion Charts for quick, intuitive interpretation of results. This Chi-Square Test example summarizes statistical significance, observed and expected counts, and adjusted residuals in a single graph.
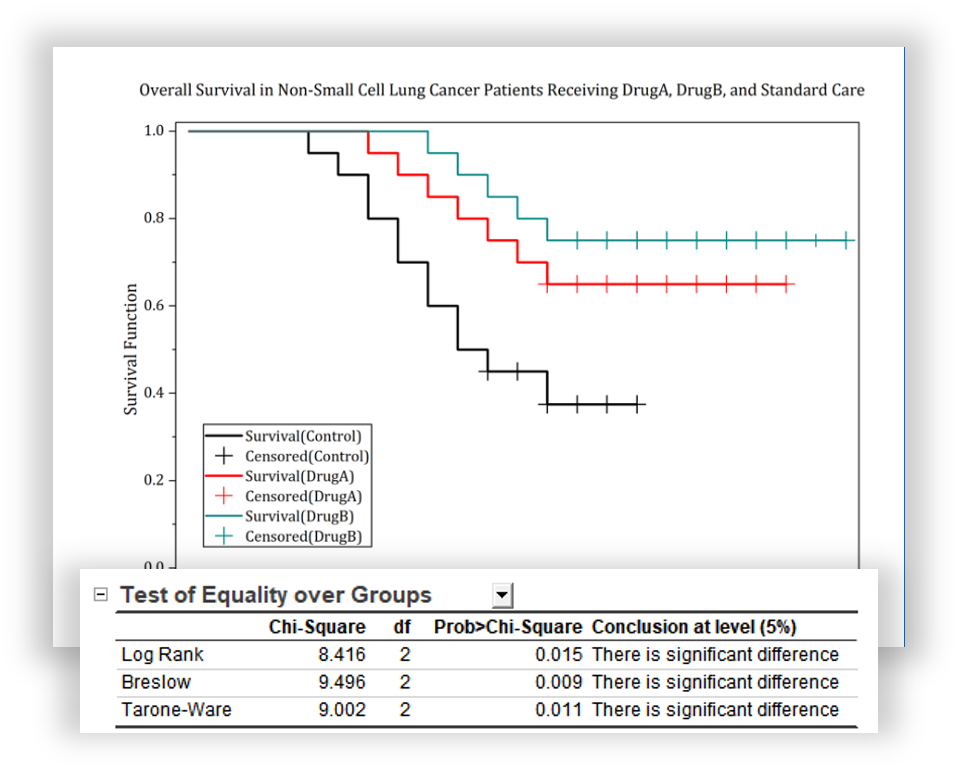
Compare survival outcomes across treatment groups using Kaplan-Meier curves. Display censored observations and statistical test results to evaluate differences in survival between groups.
Curve Fitting and Dose-Response Analysis
OriginPro provides powerful and easy-to-use curve fitting tools for life science research. A comprehensive library of built-in functions covers dose-response analysis, enzyme kinetics, ligand binding, exponential growth and decay, and other common biological assays, eliminating the need to derive or program fitting equations.
- Fit XY data with replicates directly from Structured Tables.
- Automatically generate initial parameter estimates for built-in fitting functions.
- Obtain biologically meaningful parameters such as EC50, IC50, Kd, Bmax, Km, Vmax, Hill slope, and half-life, along with confidence intervals.
- Automatically update fitting results and graphs when source data changes.
- Create publication-ready graphs with customizable fitted curves and annotations.
Advanced Curve Fitting
Perform advanced nonlinear regression through an intuitive graphical interface without programming.
- Replicate Fitting: Fit replicate measurements directly without prior averaging.
- Global Fitting: Fit multiple datasets simultaneously with shared or independent parameters.
- Weighted Fitting: Account for measurement errors and unequal variance.
- Parameter Constraints: Fix parameters or specify bounds during fitting.
- Outlier Handling: Remove or report outliers based on robust regression.
- Fit Diagnostics: Inspect residuals and goodness-of-fit statistics to evaluate fitting quality.
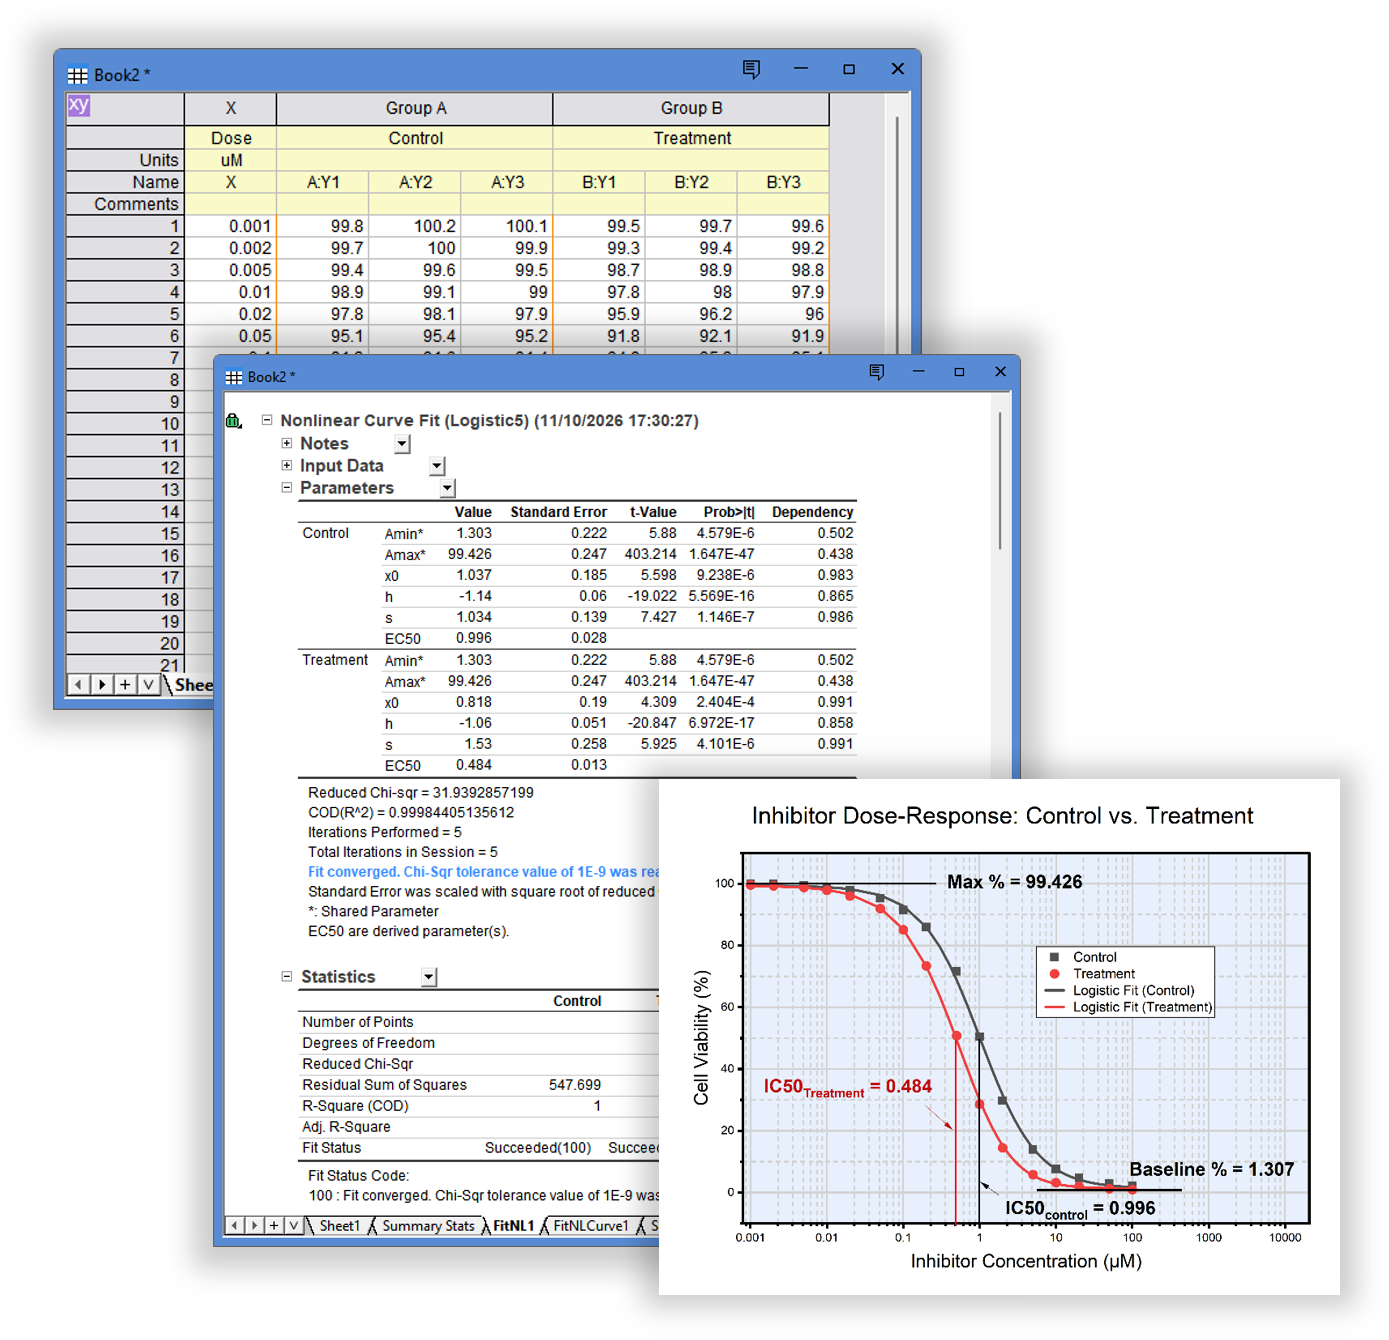
Fit replicate data directly from structured data tables without prior averaging, and compare fitted dose-response curves and IC50 values between control and treatment groups.
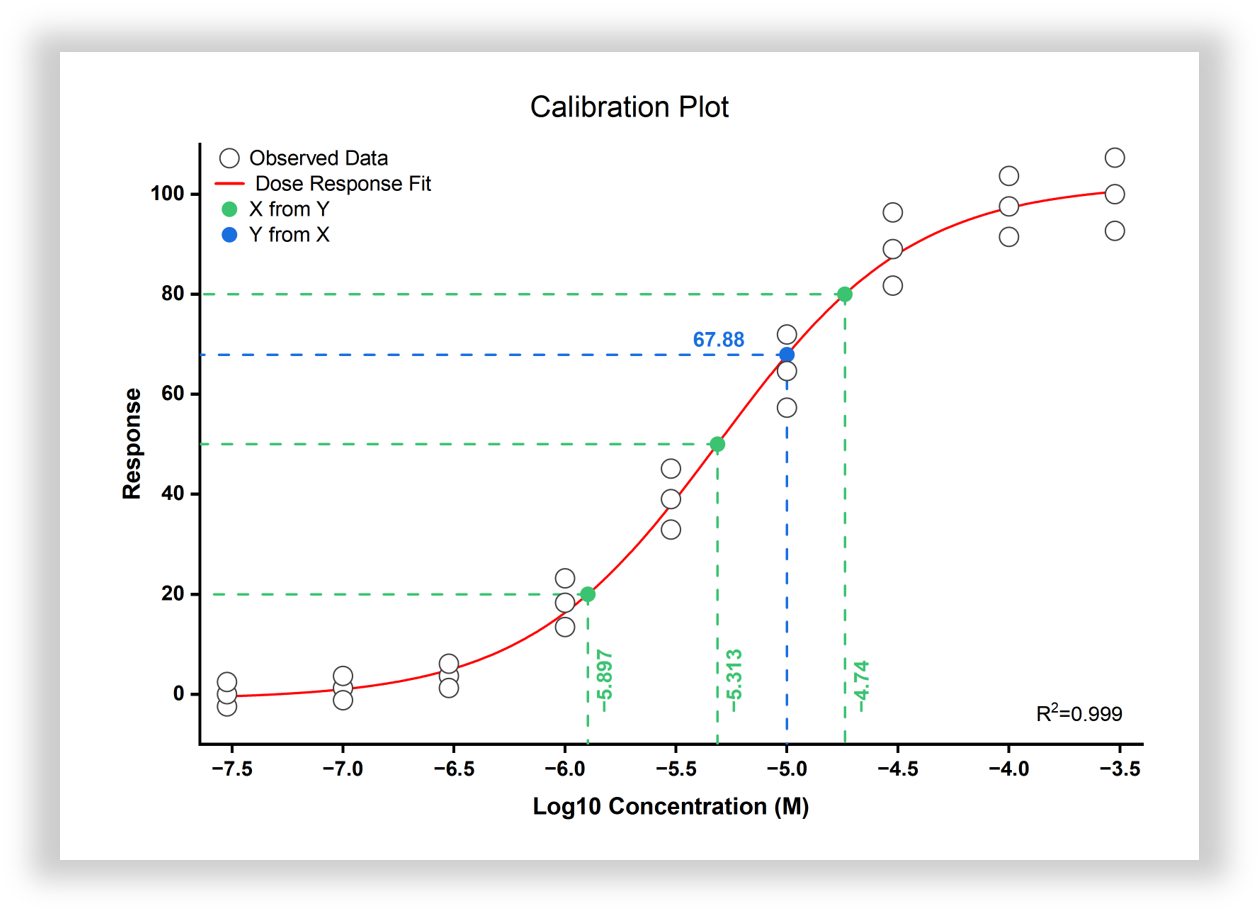
Generate standard curves from replicate assay data to determine unknown sample concentrations from measured responses. Origin supports direct fitting of replicates and calculation of X from Y or Y from X, without requiring manual averaging or interpolation.
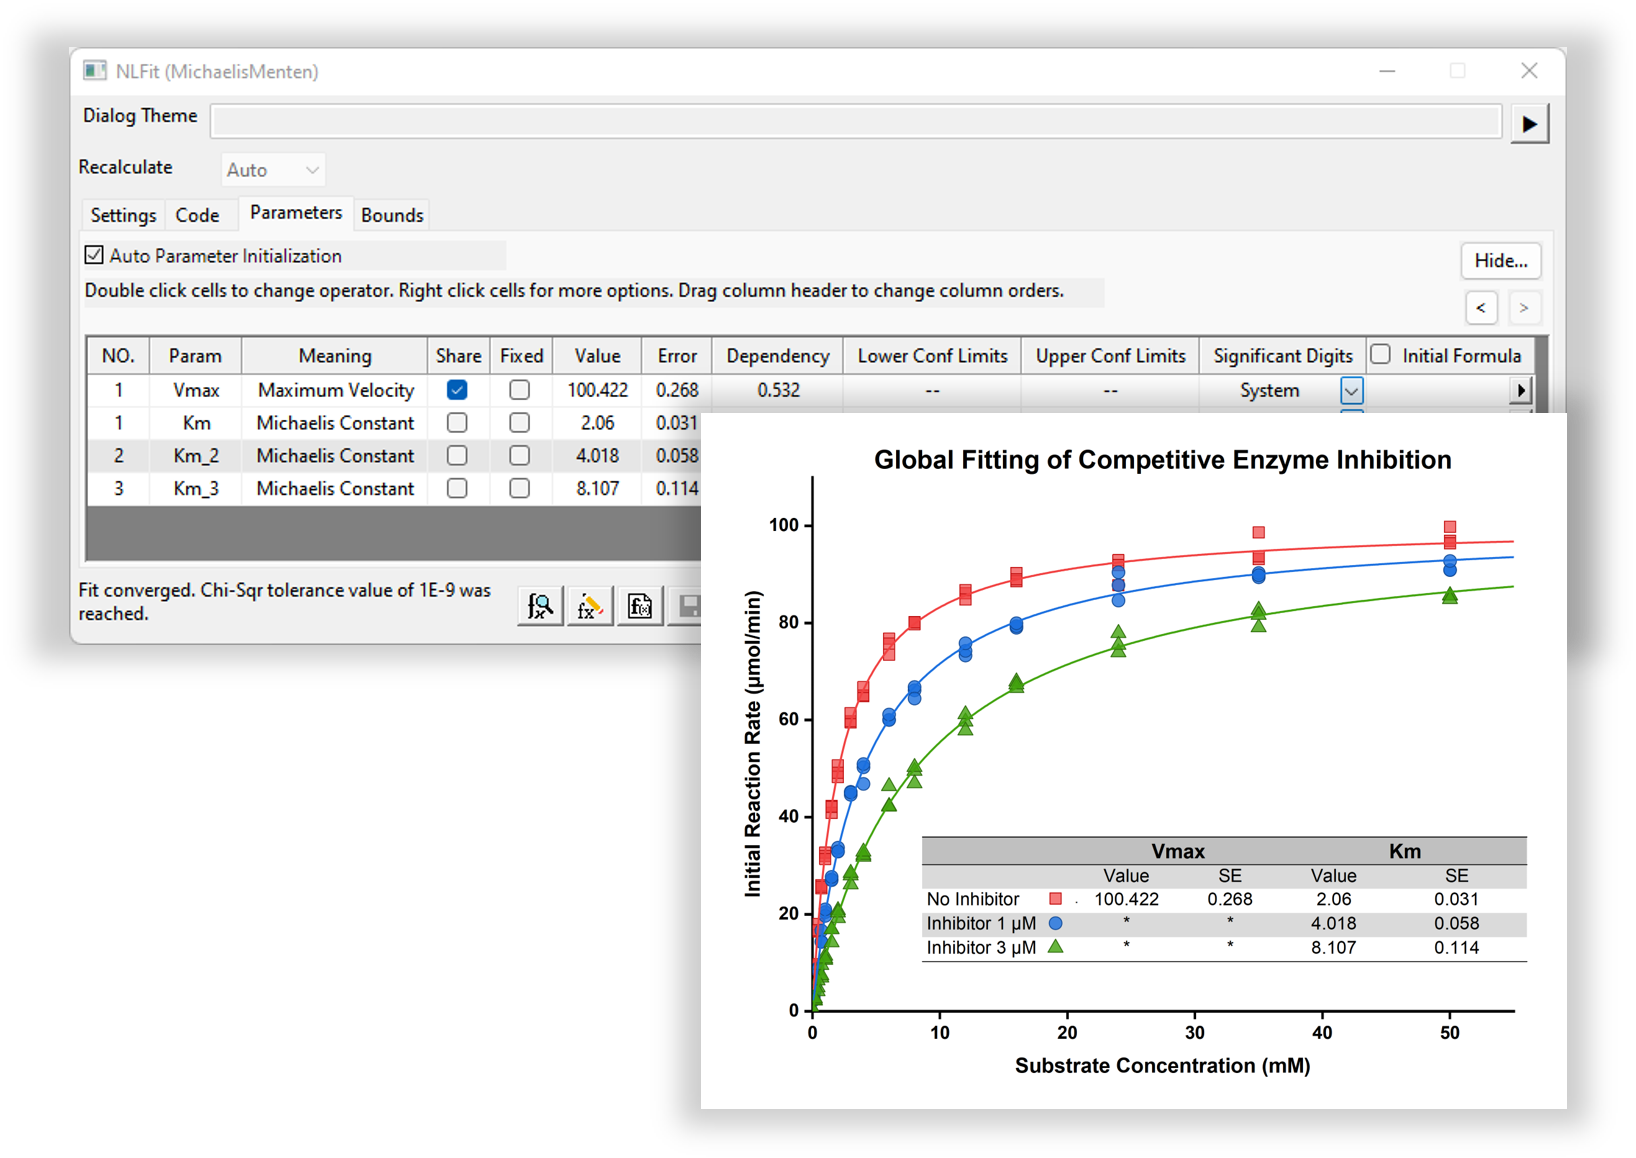
Simultaneously fit enzyme kinetics datasets with a shared Vmax and independent Km values, revealing the increase in apparent Km with inhibitor concentration.
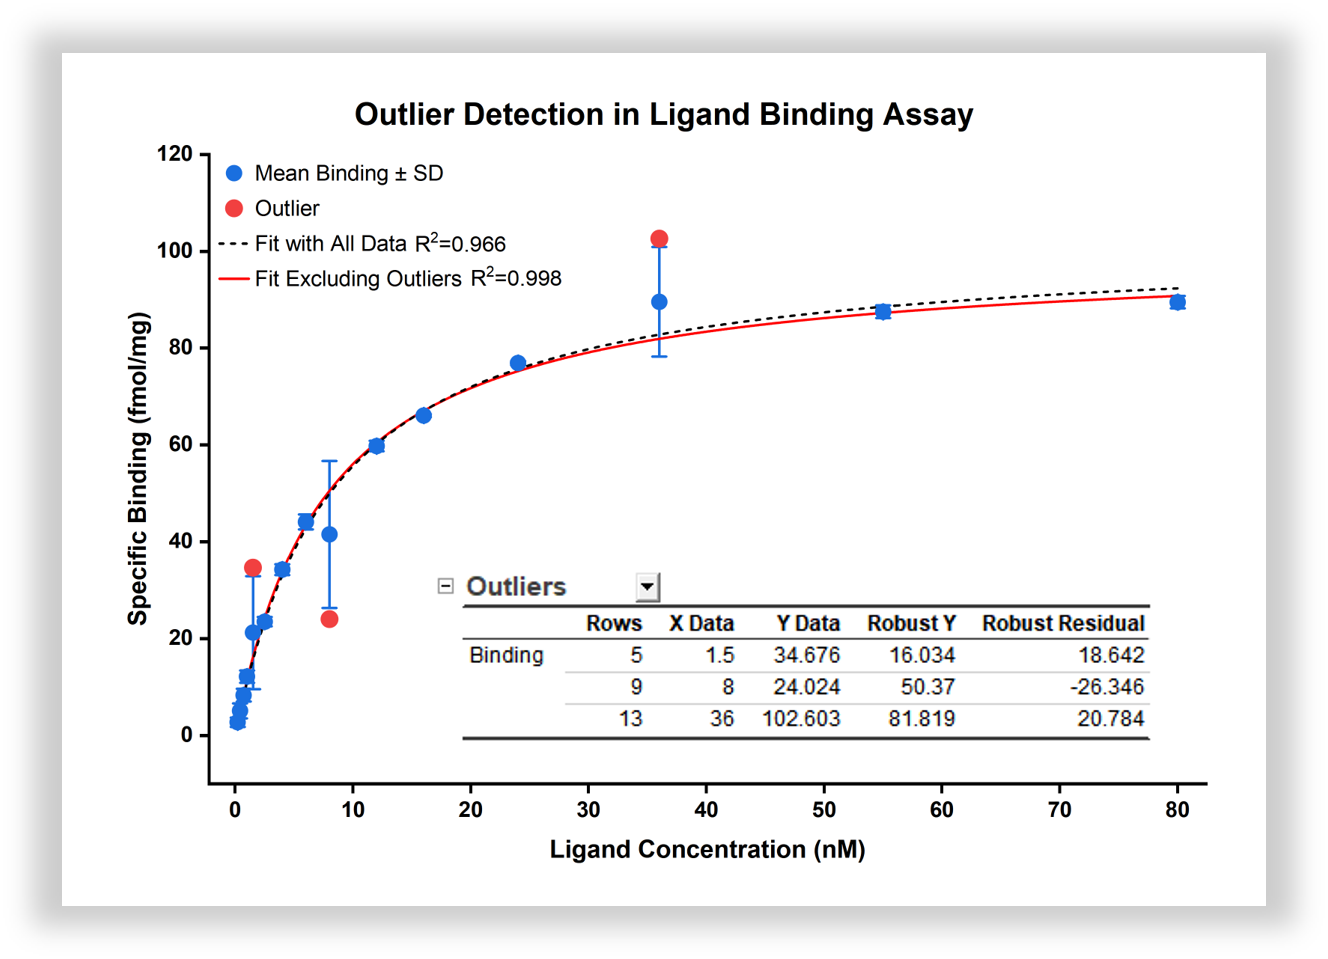
Identify potential outliers using robust fitting and highlight them on the graph. Adjust outlier detection settings to update the fitted curve and results, and assess the impact of outliers on fitting quality.
Lab Assays Analysis
Streamline common life science assays with dedicated workflows for Western Blot and qPCR data.
- Ready-to-Use Templates:
- Start with predefined data structures for common Western Blot and qPCR experiments.
- Automated Normalization
- Calculate relative protein expression or gene expression using appropriate reference measurements.
- Guided Statistical Analysis:
- Use a decision tree to select appropriate statistical tests and post-hoc comparisons based on experimental design, normality, and equal variance assumptions.
- Significance Visualization
- Generate multiple-comparison plots with p-values, brackets, stars, or letter-based grouping.
- Graph Browser
- Use Graph Browser to easily compare different multiple-comparison plots.
qPCR Analysis
Analyze gene expression data with flexible input templates and fold-change calculation methods.
Input templates:
- qPCR with ΔCt Values
- qPCR with Reference Genes
- qPCR with Reference Genes and Technical Replicates
Fold-Change calculation methods:
- Classical ΔΔCt (Livak) Method
- Biological Replicates Method
Western Blot Analysis
Simplify protein expression analysis using dedicated input templates for Western Blot data.
Input templates:
- Western Blot with Raw Band Intensities
- Western Blot with Reference Protein or Total Protein
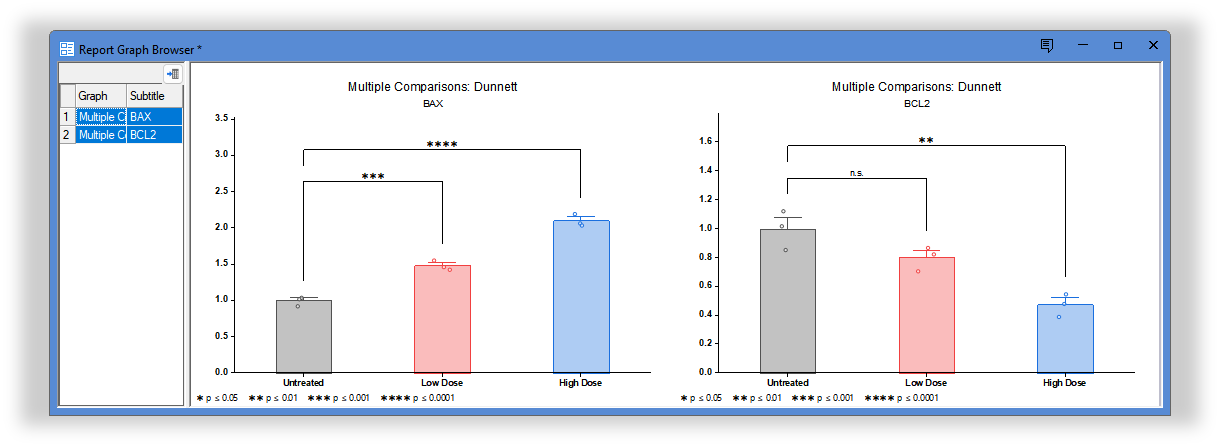
Multiple-comparison plots generated from Lab Assays analysis reports are displayed in the Graph Browser, allowing users to easily browse plots across different genes and select multiple plots for side-by-side comparison.
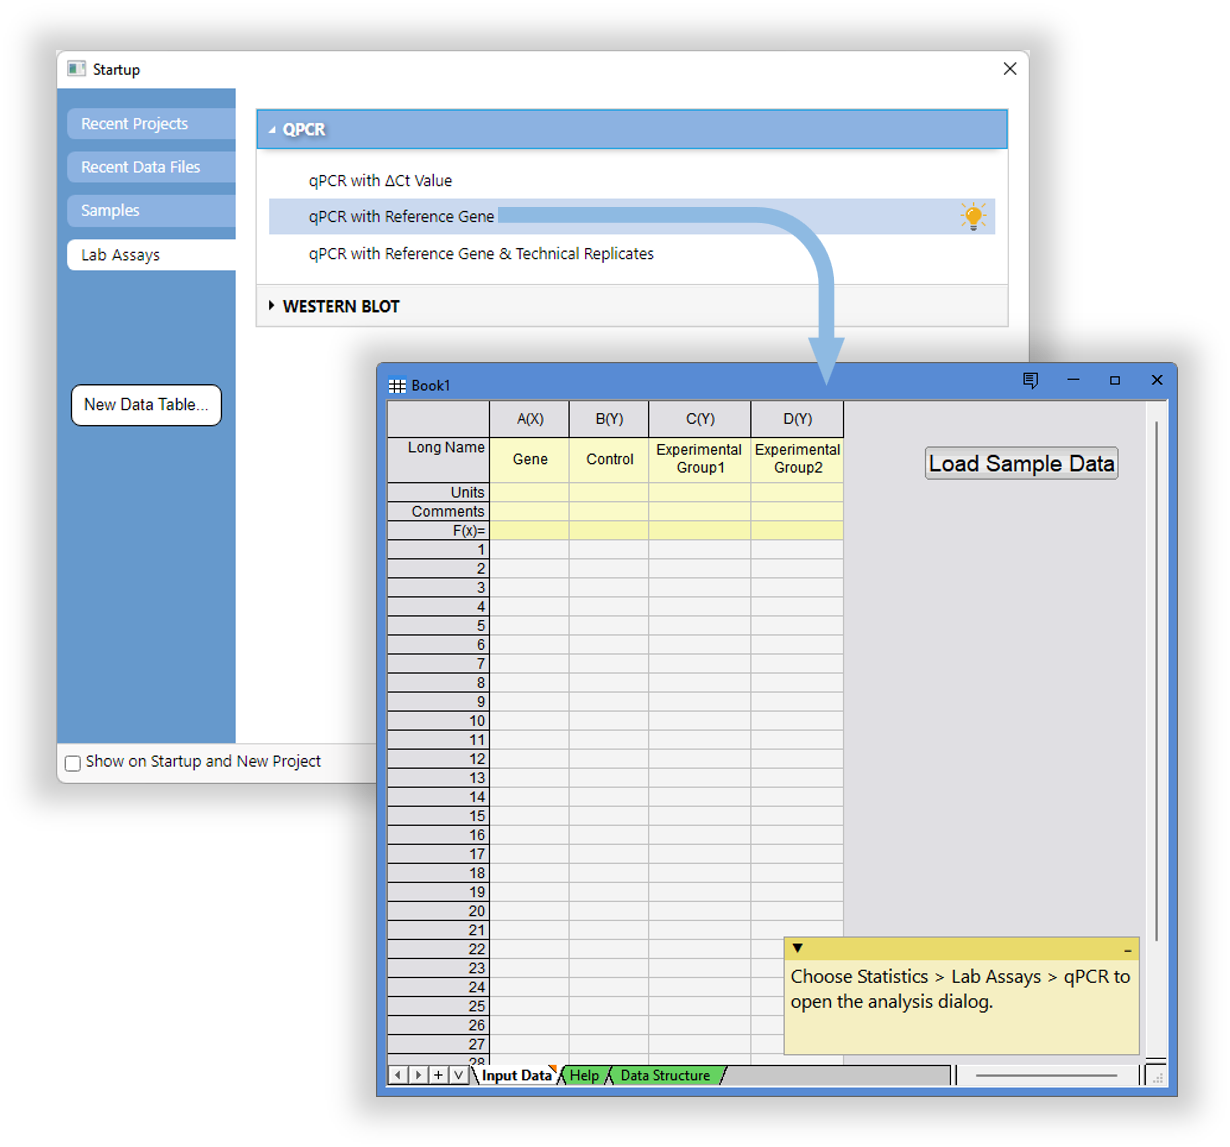
Access ready-to-use qPCR and Western Blot templates directly from the Startup dialog. Each template provides a predefined data structure and built-in guidance to help users enter experimental data and quickly get started with analysis.
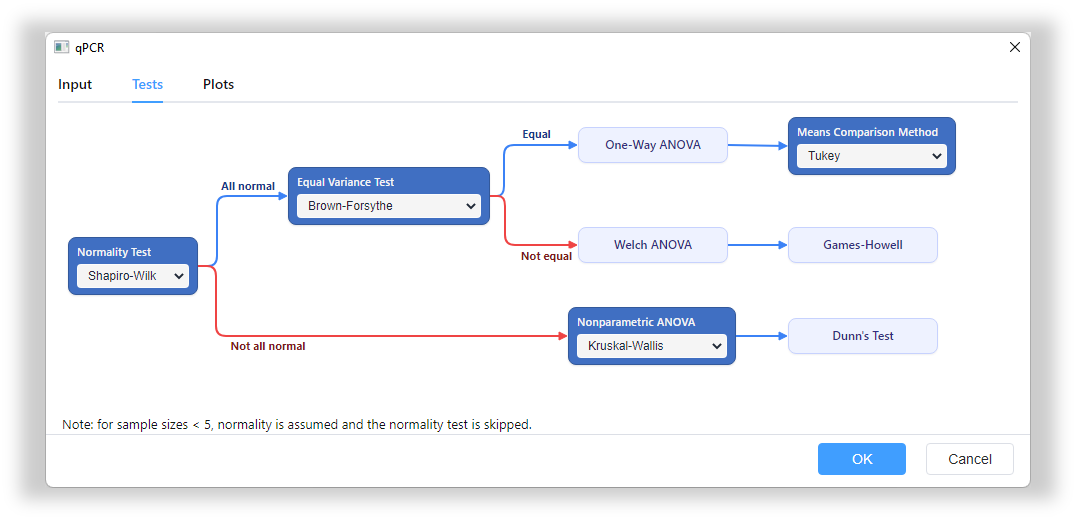
The Lab Assays dialog provides a decision tree to help users select appropriate statistical tests and post-hoc comparisons based on normality and equal variance assumptions.
Reusable Analysis and Batch Processing
Set up your analysis once and reuse it for repeated experiments.
Origin makes it easy to apply the same analysis and graphing workflow to new datasets, saving time and ensuring consistent results.
- Reusable Analysis Templates
- Save analysis settings, calculations, and graphs as templates for future experiments.
- Easy Data Replacement:
- Duplicate an analyzed workbook and replace the data to automatically update results and graphs.
- Automatic Recalculation:
- Keep analyses and graphs linked to source data so results update when data changes.
- Batch Processing:
- Apply the same analysis workflow to multiple datasets or files without repeating manual setup.
Streamline routine workflows such as dose-response fitting, enzyme kinetics, and statistical analysis across repeated experiments
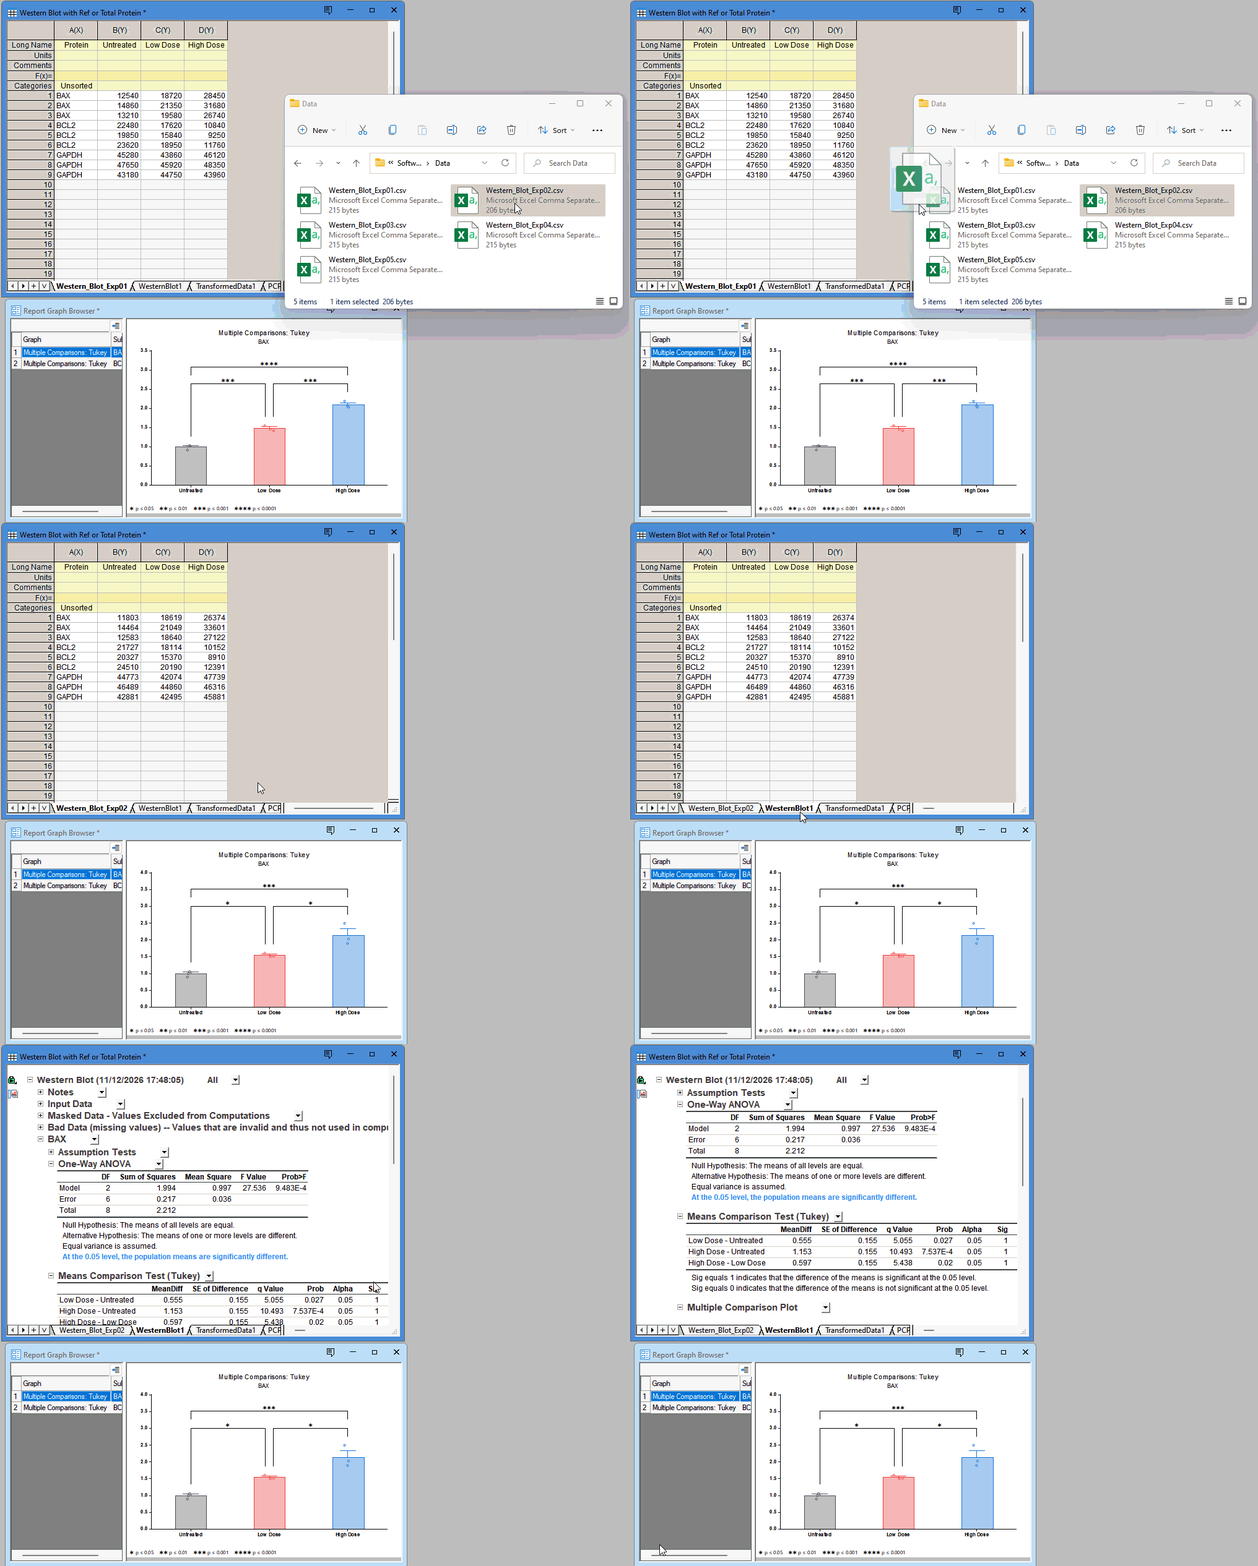
Reuse an existing analysis workbook for repeated Western blot experiments. Simply replace the protein intensity data from a new experiment to automatically update normalized expression values, statistical results, and graphs—without repeating the analysis setup.