Creating Reports in Origin
Origin provides multiple ways to create nice reports. With any of the available methods, you can format the appearance of the report as you want, adding graphs, images and analysis results as links, thus creating a custom report.
Your custom report sheets can become templates for repeated tasks -- simply import new raw data and watch your custom report automatically update. When your report is ready, export it as a PDF file or as an image file by choosing a popular image format such as EPS and JPEG.
Notes Window
Use Origin's Notes window to create custom reports
- Supports Rich Text, Markdown or HTML syntaxes
- Apply paragraph styles to text and images and create attractive reports
- Insert images, Graphs and Tables
- Insert LaTeX equations (MiKTeX required)
- Support for Placeholder sheet to copy and pre-format results for placement in report
- Report can be embedded in workbook for use as Analysis Template for batch analysis


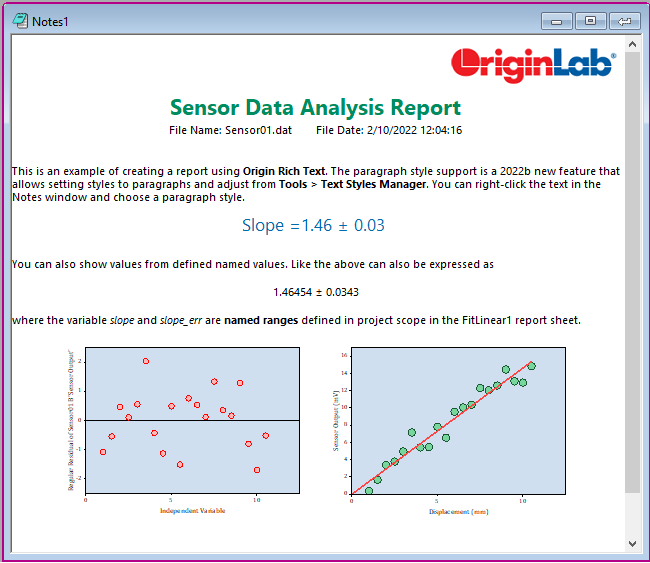
Use Origin Rich Text in a standalone Notes Window or Notes Sheet added to a workbook. Format text using various built-in, customizable styles, and add graph images and images from the project or from the web. Link to result values in report sheets to create a final report, all within Origin.
Worksheet
Use a worksheet to create custom reports
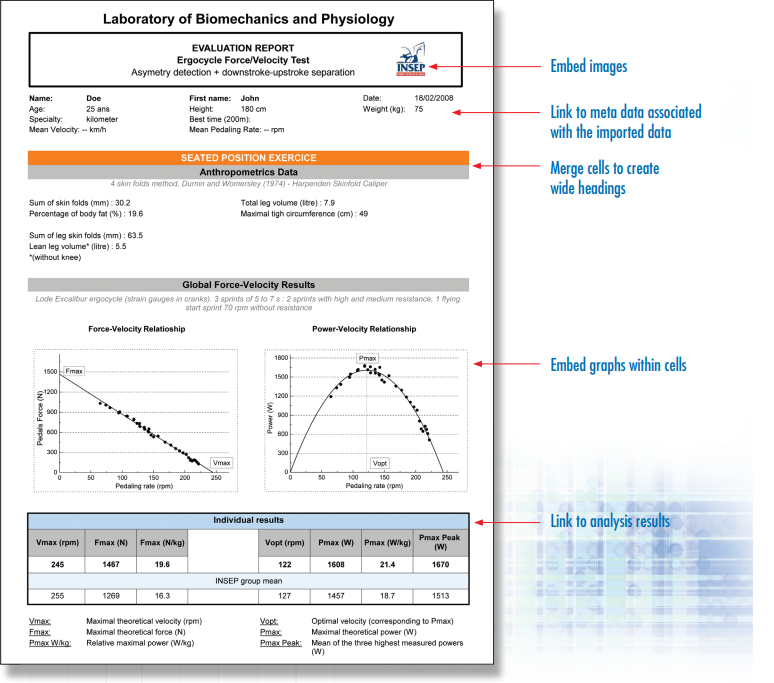
- Place graphs as floating objects or embed them in worksheet cells
- Place logos and other images
- Paste-link numeric results from report sheets and other worksheets
- Customize worksheet size, format, grids and other properties
 Creating a Custom Report Sheet >>
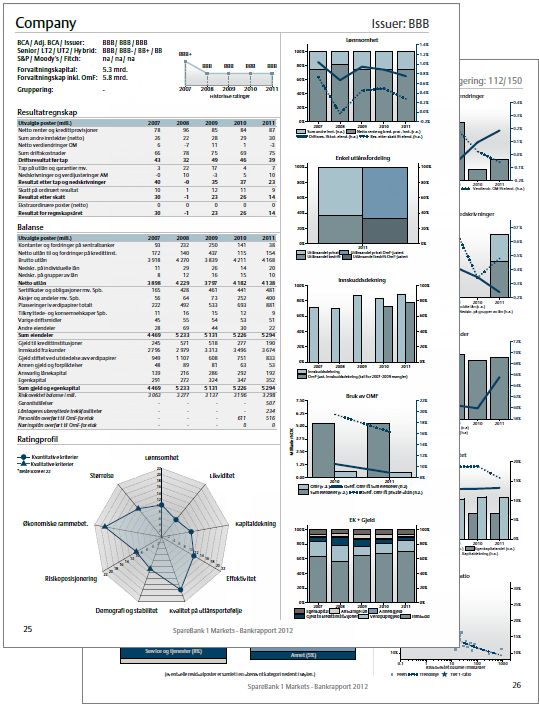
This credit rating report is created from a worksheet, for 150 Nordic banks. The report is designed to include a summary of financial reports of each bank, as well as present and explain the derived credit rating from the underlying credit model. In addition, analysis of aggregated statistics is presented as a function of time. Once new financial data is registered in the data warehouse, an updated credit rating report is created when new data is imported.
Origin multi-sheet workbooks allow you to format the appearance of cell contents, merge cells and apply borders and other custom formatting. Further, you can paste-link result values from any analysis results and graphs contained in the book or project, thus creating a custom report sheet. With the ability of automatic recalculation of analysis results, your custom reports can be part of an analysis template, for repeated tasks -- simply import new raw data, and watch your custom report automatically update. When your report is ready, export as a PDF file or an image file using any popular image format including EPS and JPG.
Layout / Graph Page
The Layout page window was originally designed as a "display panel" to combine worksheets and graphs that were created and customized in separate windows, for presentation. The Graph page window, on the other hand, evolved across versions to allow inserting tables, text, equations, images, etc. This makes it useful for creating your personalized report.
- Worksheet, table, graph (for Layout window)/multiple layers (for Graph window), text, equations, image, etc. are supported.
- Both Layout and Graph page allow arranging inserted objects (graphs, table, images, etc.) freely. You can further group multiple objects to align or move them together.
- Layout page is particularly useful for combining 3D and 2D graphs, something that is not supported in a single graph page.
- Both can be exported as image, as well as PDF.
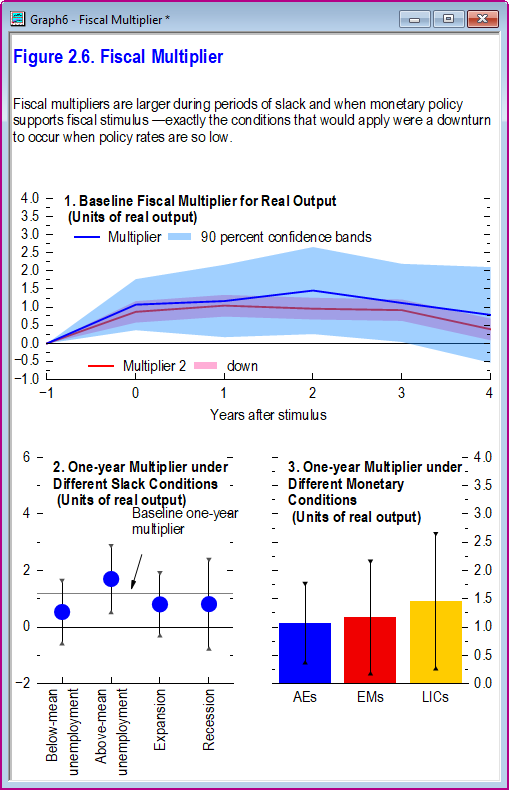
With the ability to combine tables, text, equations, and images, the graph window can also be used for creating nice reports.
Objects on the graph page are easily arranged. They can be moved and aligned individually or grouped and moved together.
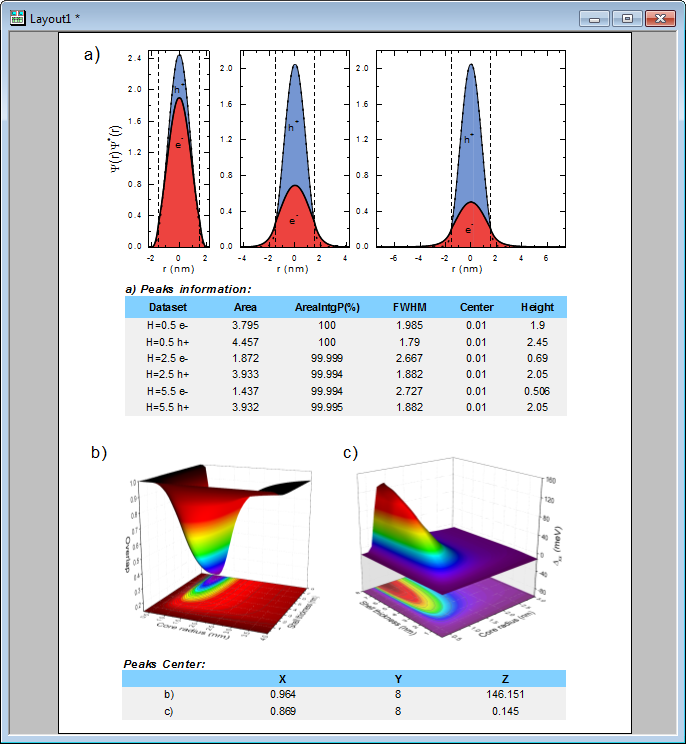
Origin's Layout Page can be used to arrange multiple graphs, text, equations, and images. The Layout Page is particularly useful for combining 3D OpenGL graphs and 2D graphs.