3.4 X-Function ReportData ExampleX-Function ReportData
Summary
This example demonstrates how to get multiple XY data sets, do linear fitting on each XY, and put the fitted data into a new result sheet.
As the output data type is ReportTree, the dialog will have a Recalculate combo box, which can set the recalculate mode of the report sheet to "Manual", "Auto Update" or "None".
You will learn
- How to work on multiple XY data setsMultiple XY Datasets.
- How to report data in a new result sheet with a recalculation lockRecalculationResult SheetReport with Auto UpdateAuto Update.
Steps
-
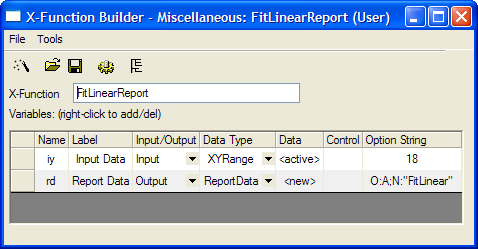
Hit F10 to open the X-Function Builder, enter the X-Function name and variables, as in the following picture, and then click Save.
 . .
-
Open this X-Function in Code Builder to edit the source code. First include the needed header file, as below.
#include <ReportTree.h> // needed for ReportTable class
-
Add any needed macros under the line //put your own support static functions here. The macros will be used in the X-Function's main function.
// ID can be any value, but must be unique.
#define TABLE_ID			1
#define SUBNODE_ID_BEGIN	1000
-
In the X-Function's main function, FitLinearReport, add the following code to get the XY data from the specified data range, do linear fitting on each XY, and generate a report sheet.
X-Function, Fitting
// create report table
ReportTable	rt;
rt = rd.CreateTable("ReportData", "Fitted Data", TABLE_ID);
int nSubID = SUBNODE_ID_BEGIN;

DWORD dwRules = DRR_GET_DEPENDENT | DRR_NO_FACTORS;
int nNumData = iy.GetNumData(dwRules);

for(int nRange = 0; nRange < nNumData; nRange++)
{
	DataRange drOne;
	iy.GetSubRange(drOne, dwRules, nRange);

	vector vx, vy;
	drOne.GetData(dwRules, 0, NULL, NULL, &vy, &vx);

	// there are two parameters in linear fitting
	FitParameter sFitParameter[2];
	if( STATS_NO_ERROR == ocmath_linear_fit(vx, vy,
	                         vy.GetSize(), sFitParameter) )
	{
		// add fitted X data to report table
		string strName = "X" + (nRange+1);
		string strLongName = "X";
		rt.AddColumn(vx, strName, nSubID++, strLongName,
				OKDATAOBJ_DESIGNATION_X);

		// calculate fitted Y data
		double dIntercept = sFitParameter[0].Value;
		double dSlope = sFitParameter[1].Value;
		vector vFitY;
		vFitY = vx * dSlope + dIntercept;

		// add fitted Y data to report table
		strName = "Y" + (nRange+1);
		string strRange;
		strRange = drOne.GetDescription(GETLC_COL_LN_ONLY);
		strLongName = "Fitted data on " + strRange;
		rt.AddColumn(vFitY, strName, nSubID++, strLongName,
				OKDATAOBJ_DESIGNATION_Y);
	}
}
Run the X-Function
- Import Linear Fit.dat from OriginExePath\Samples\Curve Fitting to a Worksheet.
- Highlight all columns and run FitLinearReport -d in the Script window, and then you can see the dialog below.
- Accept the default settings, and click the OK button. A report sheet will be generated with three group-fitting XY data sets.
|