5.1.5 Partial Correlation CoefficientPartial-Corr-Coef
Summary
The Partial Correlation Coefficient is a tool for measuring the the linear relationship between two random variables, after excluding the effects of one or more control variables.
What you will learn
This tutorial will show you:
- How to carry out partial correlation in Origin, using a practical example.
- How to interpret the generated results.
User Story
We have some public data from the World Bank that includes 11 indicators (health expenditure, GDP, population, etc.) by country, for years 2000 to 2010. We want to study the relationship between internet use, mobile phone use and health expenditures in the United States.
Detect Relationship with Pearson's R
This tutorial is associated with <Origin EXE Folder>\Samples\Tutorial Data.opj.
- Open the Tutorial Data.opj and browse to the folder Partial Correlation Coefficient, and activate the Partial Correlation Coefficient book.
- Activate Sheet1 with source data. We have already applied a data filter to get data for the United States between 2000 and 2010.
- First we will use the Correlation Coefficient tool to visually detect the relationship between Mobile phone subscribers, Total internet users, Health expenditures per capita and the GDP per capita.
- Press the Ctrl key and highlight Col(E), Col(U1), Col(H) and Col(S).
- From the menu, select Statistics: Descriptive Statistics: Correlation Coefficient.
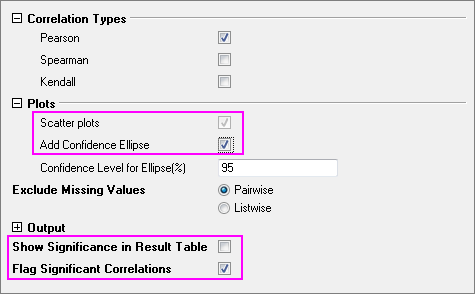
- In the opened dialog, select the Scatter plots and Add Confidence Ellipse check boxes under the Plots branch. Clear the Show Significance in Result Table check box and select the Flag Significant Correlations check box.
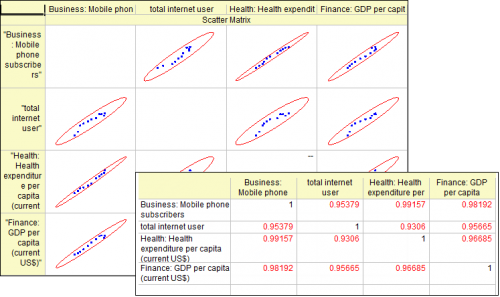
- From the Pearson's correlation coefficient and the scatter matrix, we can see:
- The scatter data are fairly linear.
- The shape of confidence ellipses is narrow.
- All Pearson's correlation coefficients are flagged in red.
- Each Pearson's correlation coefficient is larger then 0.9.
- It appears that there is a strong relationship between Mobile phone subscribers, Total internet users, Health expenditures per capita and GDP per capita.
-
Revealing the Real Relationship with Partial Correlation Coefficients
Though it appears that Mobile phone subscribers, Total internet user and Health expenditure per capita are strongly related, we know that GDP per capita also affects these three indicators. We want to measure the real relationship of the three indicators after excluding the effect of GDP per capita.
- Activate the sheet with source data. Press the Ctrl key and highlight Col(E), Col(U1) and Col(H).
- Choose menu Statistics: Descriptive Statistics: Partial Correlation Coefficient.
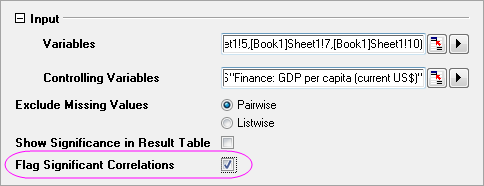
- In the opened dialog, the three highlighted columns are automatically selected as Variables.
- We want to remove the effect of GDP per capita, so we choose Col(S) as Controlling Variables. Select the Flag Significant Correlations check box.
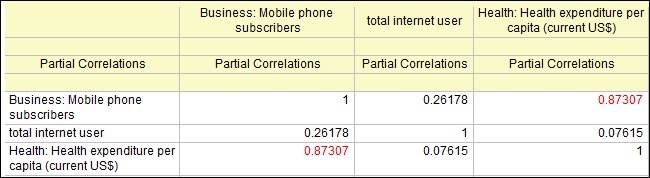
- Go to sheet PCorr1. It contains the partial correlation coefficients after excluding the effect of GDP per capita. We can see:
- Only Mobile phone subscribers and Health expenditures per capita are significantly related (The Partial Corr value is marked as red). But the real relationship is not as strong as the Pearson'r seemed to show previously. (Partial Corr = 0.87307 v.s. Pearson's Corr = 0.99157).
- The Partial correlation coefficient for Mobile phone subscribers and Total internet users decreased to be 0.26178. They are not significant related.
- There is no evidence to show Total internet users and Health expenditures per capita are related (Partial Corr = 0.07615), while previously, we obtained a Pearson's r = 0.96685.
Conclusion
Why such different results? Looking at the Pearson'r value of GDP per capita between the other three indicators, we can see GDP per capita influenced the three indicators. Even though there is no relationship between Total internet users and Health expenditures per capita, Total internet users and Mobile phone subscribers, the "false relationship" is still shown by the Pearson's r because of the effect of GDP per capita. Partial Correlation Coefficients are useful for examining the true relationship between two factors by eliminating the effects of correlated control variables. The statistic is useful for experiments where various interrelated phenomena are to be studied.
|