10.1.1 Exporting GraphsExpGraphs
Summary
When you have completed your graphs for publication, exporting your final results is very easy with Origin.
The graph export is highly customizable. You can specify the size of the image, the file format, and other advanced settings such as color format.
What you will learn
- How to export a graph and specify the settings.
- How to export specified graphs in the project.
Export a graph as an eps image
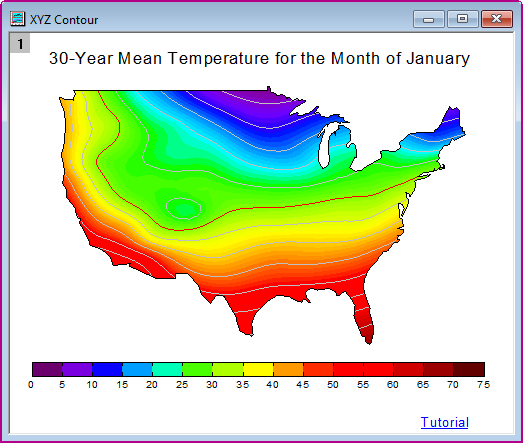
This tutorial is associated with the XYZ Contour project (C:\ProgramData\OriginLab\(version number)\Origin\Central\Graphing\Contour Plots - XYZ Contour.opju) . You can also open Learning Center, select Contour Plots plot type and then double-click on the icon of XYZ Contour graph to open this project.
- With the project opened, activate the graph window below.
- Select File: Export Graphs : Open Dialog from the Origin menu to open the expGraph dialog.
- Click the Auto Preview check box. Then the graph will auto preview the temporary copy in the right panel of the dialog.
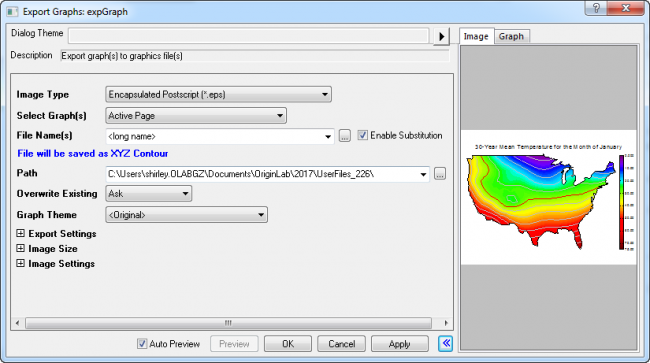
 | If your Image tab preview appears blank, you are likely viewing only a corner of a very large raster image. Starting with Origin 2019, you can right-click in the Image tab and choose a zoom level for previewing your raster or vector images. By manipulating the size of the Preview panel + the Image tab zoom level, you'll be able to view your entire graph.
|
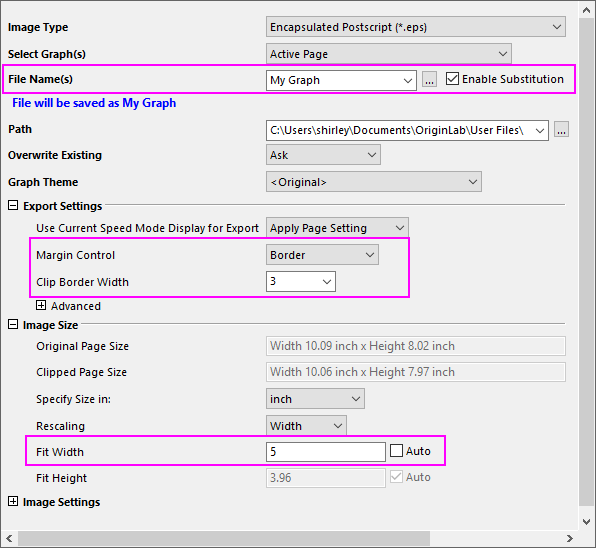
- Specify the following settings to export the graph:
- Customize the File Name to My Graph.
- Expanding the Export Settings node, select Border from the Margin Control drop-down list and type 3 in the Clip Border Width box.
- Expanding the Image Size node, uncheck Auto check box for Fit Width and set width to 5.
- Click the triangle button to the right of the Dialog Theme. Select Save As from the shortcut menu. The Theme Save as dialog opens.
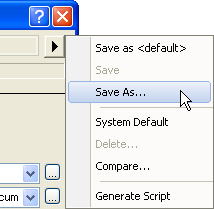
- In the Theme Save as dialog, enter My EPS Export as Theme Name. And click OK.
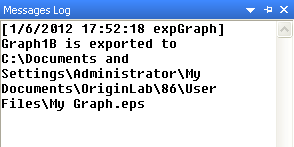
- Click the OK button in the expGraph dialog, then My Graph.eps is created in your User File Folder. And the graph path will display in the Message Log.
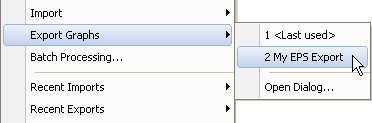
- Repeat export a graph using the setting from above, select the theme My EPS Export in the fly-out menu of the export graph tool directly.
Or
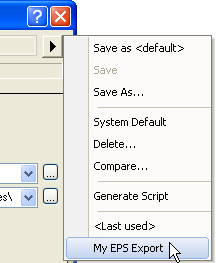
Click the right-sided triangle button to the right of the Dialog Theme in the expGraph dialog. From the shortcut menu, pick My EPS Export. The settings from that theme will then be loaded in the dialog.
| In the last couple of steps, you saved your custom export settings as an external Theme file and learned to apply that Theme from the expGraph flyout menu. Beginning with Origin 2021, export settings are automatically saved with the graph on export. If you are are not exporting your graph immediately, you can save settings by clicking on the Dialog Theme flyout menu and choosing Save to <Graph>.
|
Export the specified graphs
- Open the sample project file Column and Bar.opju under the sample folder <Origin EXE folder>\Samples\Graphing.
- In the Project Explorer, click on the folder "Column_Plot_with_Baseline_Y=0.5" and activate the graph window in it.
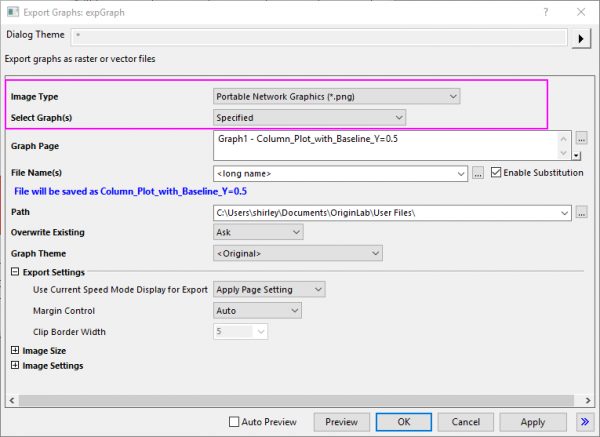
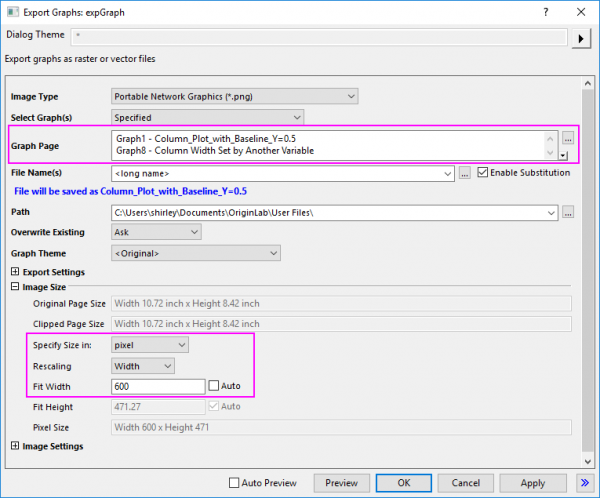
- Select File: Export Graphs to open the expGraph dialog, in the dialog, select Portable Network Graphics(*.png) for Image Type.
- Select Specified from the Select Graph(s) drop-down list. Click the
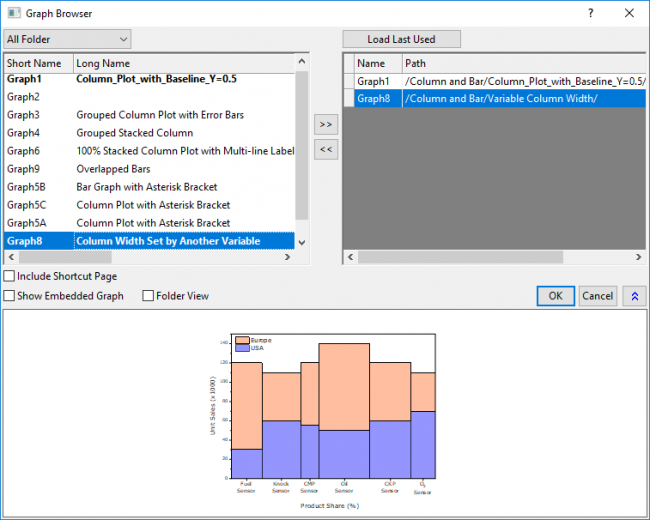
 button to the right of the Graph Page edit box to open the Graph Browser dialog. button to the right of the Graph Page edit box to open the Graph Browser dialog.
- In the Graph Browser dialog, all the graphs in this project will list in the left panel of the dialog. Select Graph8 in the left panel, then the preview panel will show a preview of the graph.
- Click the
 button to add the selected graph to the right panel, or double-click selected graph in left panel to add to the right panel. button to add the selected graph to the right panel, or double-click selected graph in left panel to add to the right panel.
- Then click OK button, the specified graphs will show in the Graph Page box. Expanding the Image Size node, select pixel from the Specify Size in drop-down list. And uncheck the Auto check box for Fit Width and set width to 600.
- Click OK button in the expGraph dialog, then two images are created. And the graph path will display in the Message Log.
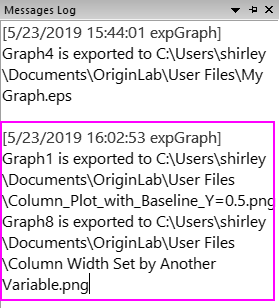
|