9.4.2 Enhanced Digitizerenhanced-digitizer
Summary
The Enhanced Digitizer supports auto tracing and digitizing in 2D Cartesian, polar and ternary coordinate systems.
NOTE: The Enhanced Digitizer is built into Origin 2015 SR0 and later versions. If you are running Origin 9.1, the Enhanced Digitizer is available as an add-on tool from the OriginLab File Exchange. The Enhanced Digitizer is not supported by versions prior to Origin 9.1 SR1.
What You Will Learn
This tutorial will show you how to:
- Set axes in the image.
- Manually and automatically capture data points.
- Set axes for polar and ternary coordinate systems.
Steps
Import Image and Clear Gridlines
- Select the Digitize Image
 button on the Standard toolbar. button on the Standard toolbar.
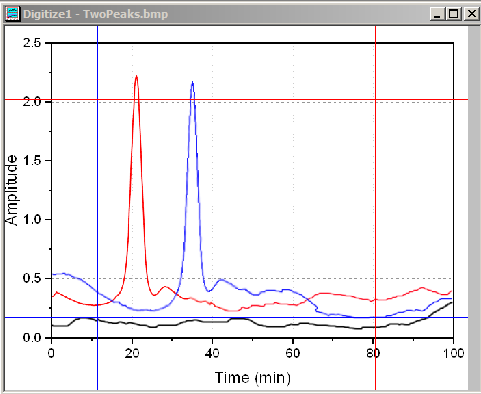
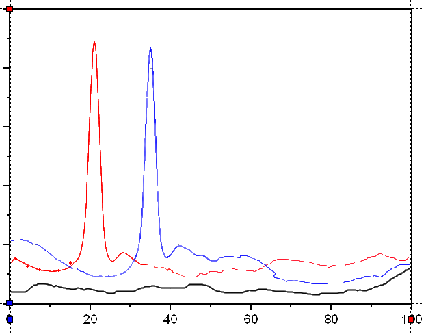
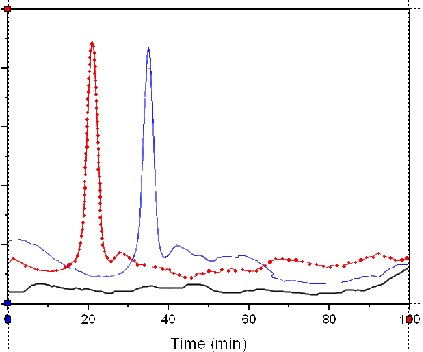
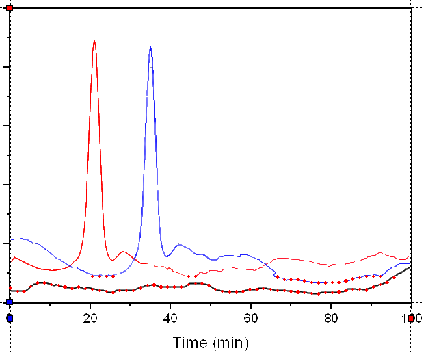
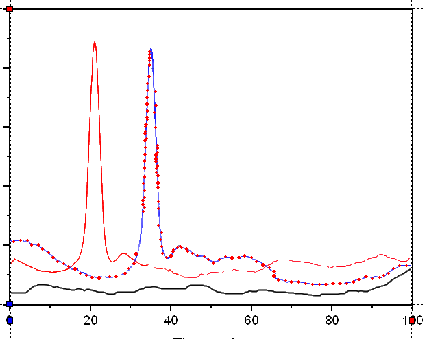
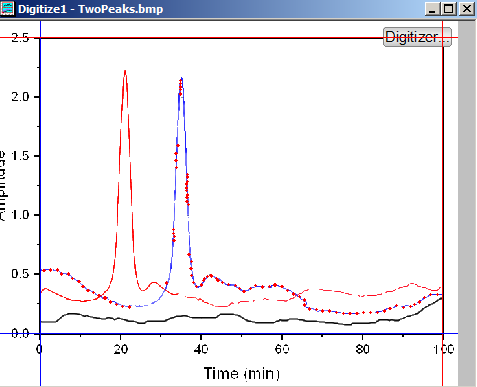
- Browse to the folder <Origin EXE Folder>\Samples\Import and Export and open TwoPeaks.bmp. There are three line plots in the image: the black plot is the baseline and the red and blue plots are spectra.
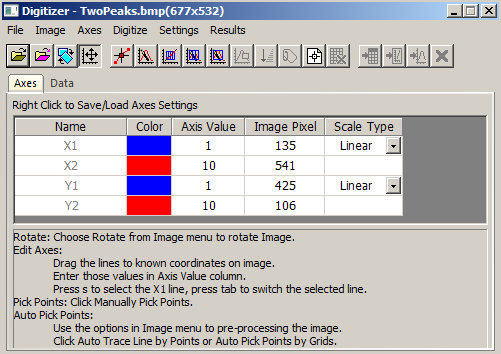
- In the Digitizer dialog, there are hints at the bottom of the Axes tab to guide you through each step.
- Select Image:Remove Cartesian Gridlines to remove the gridlines.
You can also choose Image: Rotate... and Image: Clear Background menus to rotate the image and clear background noise and color fills.
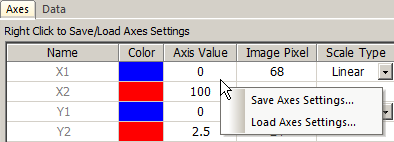
Edit Axes
Before capturing data points, you need to setup axes on the image so that there is a reference for calculating the XY coordinates of the data points that will be captured later.
-
Click the Edit Axes
 button or make sure it is pressed. button or make sure it is pressed.
-
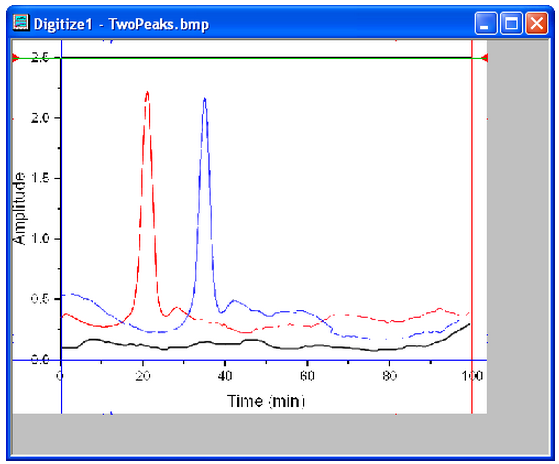
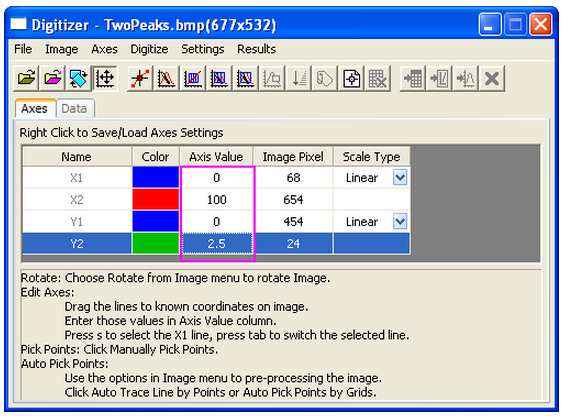
Four lines will appear framing the image. Drag each line so that it lines up at a location where you know the axis values and enter the axis value in the corresponding row in the Digitizer dialog.
Use the Zoom and Pan  button on the Tools toolbar or hold down A and use the mouse wheel to zoom in and pan the image. Then fine tune the line location. Press Ctrl+W to restore the original image size. button on the Tools toolbar or hold down A and use the mouse wheel to zoom in and pan the image. Then fine tune the line location. Press Ctrl+W to restore the original image size.
- After editing Axes, you can right click and save Axes settings in order to load them in the future for similar images.
Capture Data Points
Besides the Manually Pick Data Points method, the Enhanced Digitizer provides four automatic digitizing methods to capture data points. They are all under the Digitize menu and have corresponding buttons.
| Name
|
Icon
|
Function
|
| Manually Pick Points
|

|
Double click on every spot you want to capture a point.
|
| Auto Trace Line By Points
|

|
Double click on a curve on the image and data points will automatically be captured along the curve.
|
| Auto Pick Points By Grids
|

|
Drag a rectangle on a desired area of the image and data points will be captured where ever the gridlines in rectangle intersect with the image curve.
|
| Area Auto Trace
|

|
This is a hybrid of the previous two methods. Drag a rectangle on a desired area of the image. Data points will automatically be captured along the curve.
|
| Boundary- Limited Area Auto Trace
|

|
Similar to the Auto Trace Area button except that points are created only within the selected area.
|
Manually Pick Points
Let's manually capture some points on the red line.
-
Click the Manually Pick Points button.
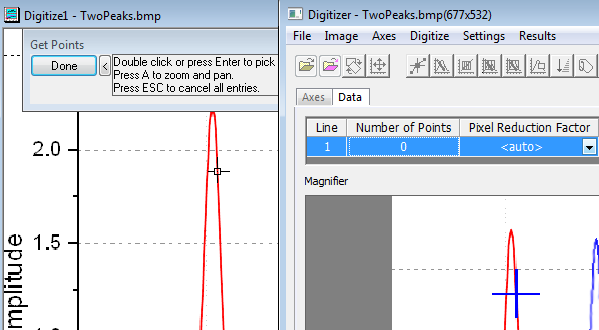
-
Double click on the red curve to pick a point.
The Magnifier window on the Data tab of the Digitizer dialog provides a blown up view of where the cursor is. You can also use the Zoom and Pan tool mentioned in the Edit Axes section to zoom and pan the image to pick points more precisely.
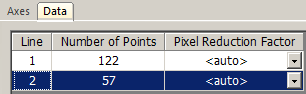
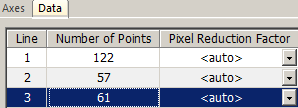
- Pick several more points and click the Done button. The Number of Points on Line 1 of the Data tab shows the number of points that were captured for Line 1.
If you want to move or delete a captured point,click the captured point in the image to select it. Use the arrow keys on the keyboard to move the point or press the Delete key to delete it.
You can click the Manually Pick Points button again to pick more points for line 1.
Auto Trace Line by Points
Multiple digitizing methods can be used on same line as long as the line is highlighted on the Data tab of the Digitizer dialog. Let's pick more red points for Line 1 using the Auto Trace Line by Points method.
-
Click the Auto Trace Line by Points button.
-
Double-click on red points to the left side of the peak and the right side of the peak. Every time you double click a point, Origin auto traces to find more points along the curve. Click the Done button.
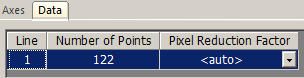
- There are in total 122 points captured on the red line.
-
Click the Go to Data
 button to see the results in a worksheet. button to see the results in a worksheet.
Auto Pick Points by Grids
Next let's use the Auto Pick by Grids method to digitize the black baseline.
- Activate the image window.
- Click the New Line
 button. The Data tab will start a new row for Line 2. button. The Data tab will start a new row for Line 2.
Note: All plots in this image use the same XY axis so we don't need to edit the axes again. However, in case you have images with multiple axes, you can setup a new axis for each new line of data.
-
Select the Auto Pick Points by Grids button.
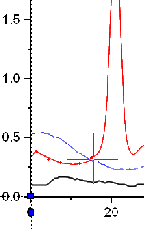
-
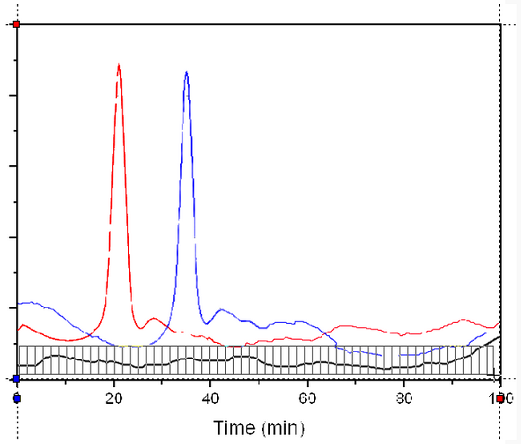
Click and drag to create a rectangle on a portion of the black baseline as shown below:
Some points on the red and blue lines are captured as well.
- To remove unwanted points, click the Delete Points
 button. button.
-
Drag a rectangle box over the unwanted points and release the mouse button to delete them.
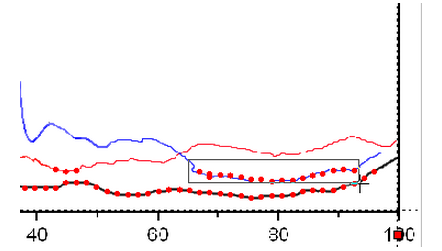
With this method, only 57 points are captured.
-
If you are not satisfied with the result, click the Delete Line
 button to delete Line 2 on the Data tab of the Digitizer dialog and click the New Line button to start over. button to delete Line 2 on the Data tab of the Digitizer dialog and click the New Line button to start over.
You can use the Settings: Digitize Settings... menu to customize the grids density.
Area Auto Trace/Boundary-Limited Area Auto Trace
Let's use these two methods to digitize the blue line.
-
Click the New Line button.
-
Click the Area Auto Trace button.
-
Click and drag a rectangle over some part of the blue curve. Points will be auto created along the blue curve beyond the rectangle.
-
Select the Boundary-Limited Area Auto Trace button.
- Click and drag a rectangle over some part of the blue curve. Points will be auto created only within the rectangle you drew. Unlike in the Auto Pick Points by Grids method, the Boundary-Limited Area Auto Trace method creates more points than just where the curve intersects with the grids.
-
Click the Reorder Points
 button to set the captured points in order. button to set the captured points in order.
-
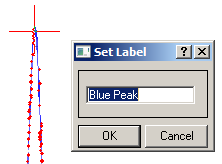
Click the Set Label
 button. button.
-
Click on the selected peak point of blue line and press the Enter key.
-
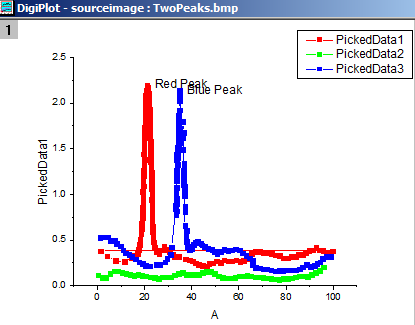
Enter Blue Peak in the dialog to add a label to the peak of the blue line.
-
To add another label on the peak of the digitized red line, click the Set Label button again to release it first.
-
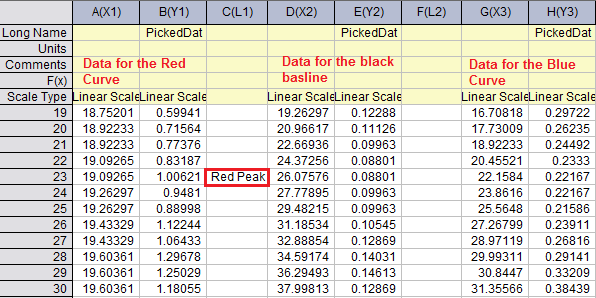
Select Line 1 to show digitized red points on the Image. Repeat the same process, this time set the label as Red Peak.
-
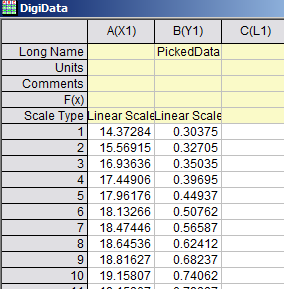
Select the Go To Data button. You can see the Labels added are in corresponding Label rows.
- With the image window active, click the Go To Graph
 button. button.
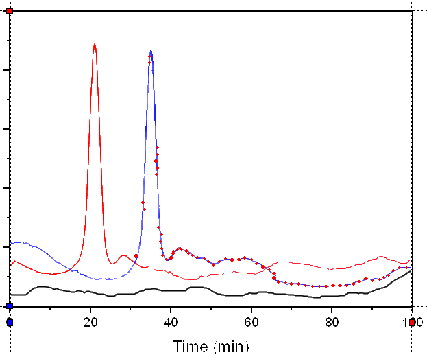
All the curves resulting from the picked points will show in one graph window.
- You can save the project with the Digitizer in it. When you open the project in the future, there will be a Digitizer... button on the image and you can click it to continue Digitizing.
Set Axes for Polar and Ternary Plots
The following section only explains how to define axes for images with polar or ternary coordinate systems using the Enhanced Digitizer. Once the axes are defined the same methods outlined above can be used to digitize the image.
Polar Coordinates
-
Click the Import
 button in the Digitizer dialog. button in the Digitizer dialog.
-
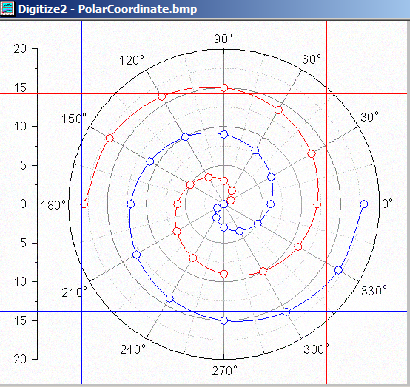
Browse to the <Origin EXE Folder>\Samples\Import and Export folder and select PolarCoordinate.bmp.
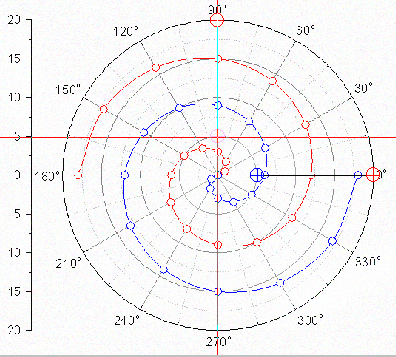
The data plots in this image are in the polar coordinate system.
-
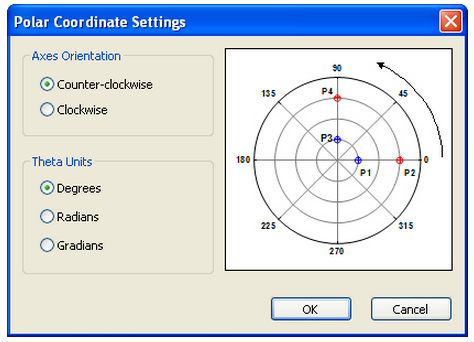
By default the Digitzer uses the Cartesian Coordinate system. Select Axes:Polar Coordinate... menu to open the Polar Coordinate Settings dialog box.
-
We can accept the default orientation and theta unit and click OK. Two line objects with anchor points show on the image.
To set the axes for polar coordinates, we need to make sure each line object follows the same radius line, i.e. P1 & P2, or P3&P4 need to be at the same angle.
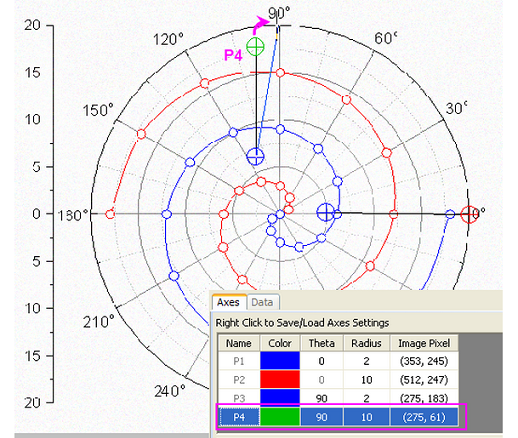
-
Drag each line's anchor points to known positions. Note: You can press theSpace key to make the cursor bigger so that it is easier to locate the desired position.
-
Enter the corresponding Theta and Radius values on the Axes tab of the Digitizer.
Ternary Coordinate
-
Click the Import button in the Digitizer dialog.
-
Browse to the <Origin EXE Folder>\Samples\Import and Export folder and select TernaryCoordinate.bmp. The data plots in this image are in the ternary coordinate system.
-
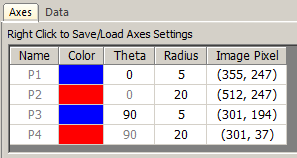
Select Axes:Ternary Coordinate... to open the Ternary Coordinate Settings dialog.
-
Specify the Axes Orientation and Range of Variables (i.e. whether the ternary plot is normalized to 0 - 1 or 0 - 100). For this example, accept the default settings and click OK. Three anchor points are added to the image.
- Drag these three points to the three vertices of the ternary plot.
- Similarly to the polar coordinate anchor point control, the row of selected anchor points in the graph will be highlighted on the Axes tab:
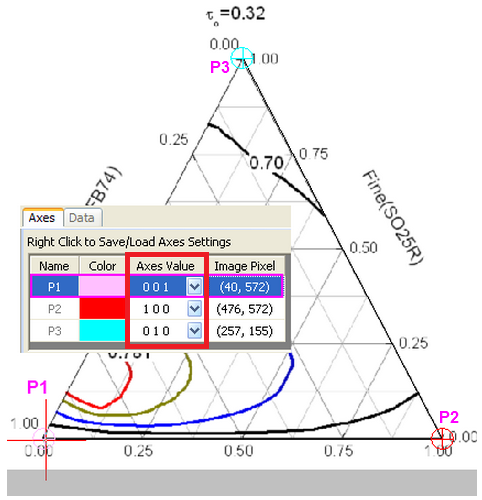
- The Axes Values of each point are X Y Z respectively. The X, Y, Z values of P1 in the ternary image are 0 0 1 because P1 is at the end of the Z axis. Similarly P2 and P3 lie at the end of the X axis and the Y axis, so the X,Y, Z values should be 1 0 0 and 0 1 0 respectively. Logically therefore, P1, P2 and P3 can't be same values.
|