5.3.3 Two Way ANOVATwoWayANOVA
Summary
In some cases, we want to examine the relationship between two factors (categorical variables) and a continuous outcome variable. The effects on the outcome of the change in one factor may depend on the level of the other factor, so we need to consider the interactions between two factors. Two way ANOVA is an appropriate method to analyze the main effects of and interactions between two factors.
Minimum Origin Version Required: Origin 2016 SR0
What you will learn
This tutorial will show you how to:
- Perform Two-way ANOVA
- Interpret results from Two-Way ANOVA
- Make the Interaction Plot
Steps
Researchers are interested in the effects of sex and dietary group on systolic blood pressure (SBP) The "dietary group" factor includes three groups: strict vegetarians (SV) who eat no animal products of any kind; lacto vegetarians (LV) who eat dairy products but no other animal products; and "normal" (NOR) subjects who eat a standard American diet. Sex and dietary group may be independent or they may interact with each other. One approach to solve this problem is to construct a two-way ANOVA model predicting mean SBP level.
Indexed data mode
Perform Two Way ANOVA
- Start with a new workbook and import the file \Samples\Statistics\SBP_Index.dat.
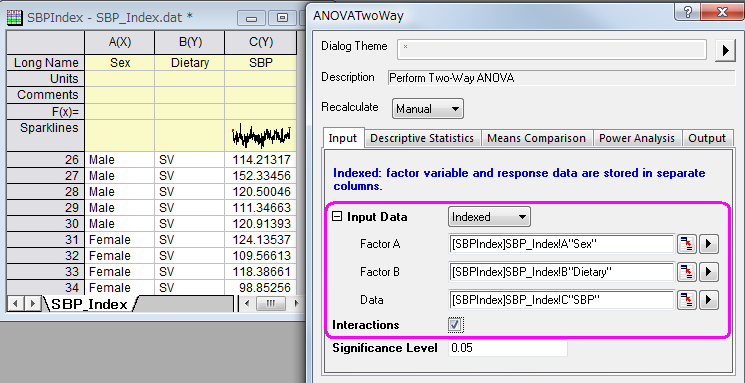
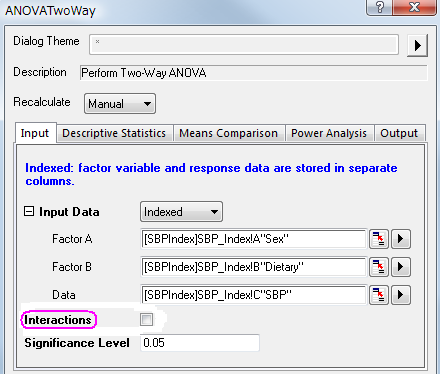
- Open the Two-Way ANOVA dialog by choosing the menu item Statistics: ANOVA: Two-Way ANOVA, then in the Input tab, set the Input Data mode as Indexed.
- Also in the Input tab, select column A,B and C for Factor A,Factor B and Data, respectively. Check the Interactions box.
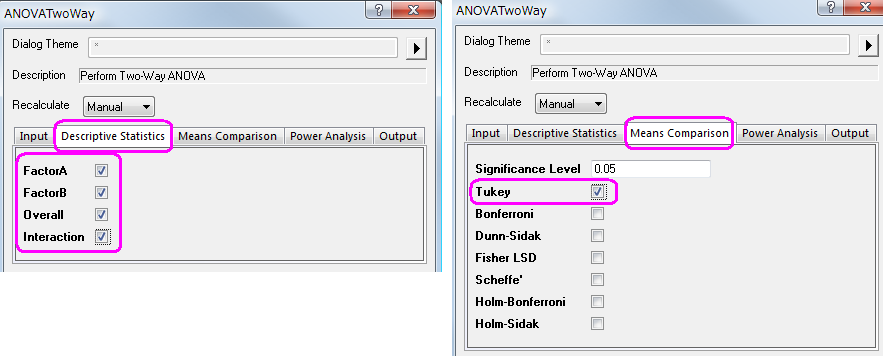
- In the Descriptive statistics tab, check all boxes.
- In the Means Comparison tab, set Significance Level to 0.05, and check the box beside Tukey to select this test as the means comparison method.
- Click the OK button to perform Two-Way ANOVA.
Interpreting Results
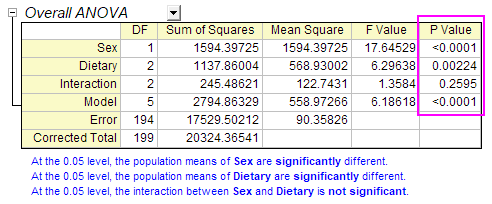
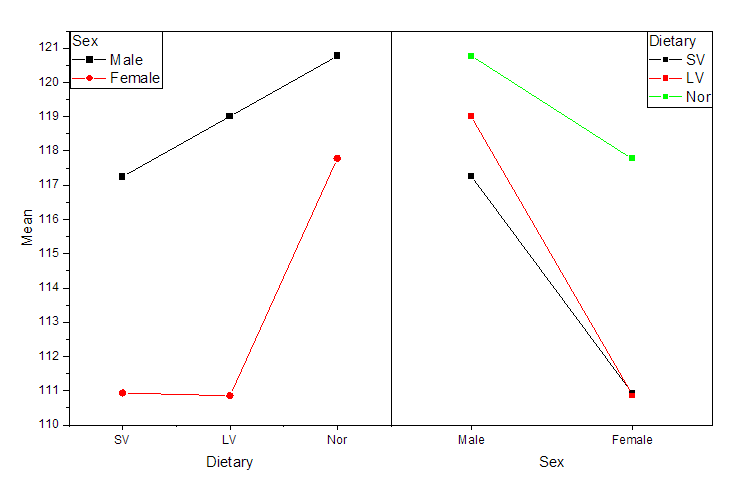
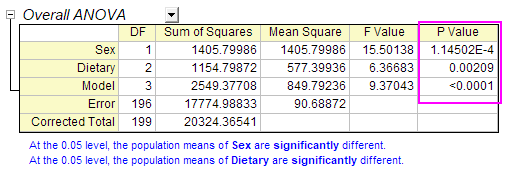
From the "Overall ANOVA" table in the Two-Way ANOVA result sheet, we can see that Dietary and Sex are both significant factors, but the interaction between them is not significant. So we can say that the main effects of both Dietary groups and Sex are significant, yet the effect on the outcome of the change in Dietary doesn't depend on the level of Sex.
The Interaction Plot
To further detect interaction, we can make an "Interaction Plot" using the following steps.
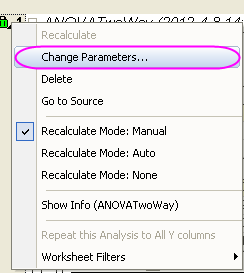
- Click on the green lock in the ANOVA2Way1 result sheet, and select Change Parameters to open the dialog again.
- Go to Mean Plot, and check all boxes.
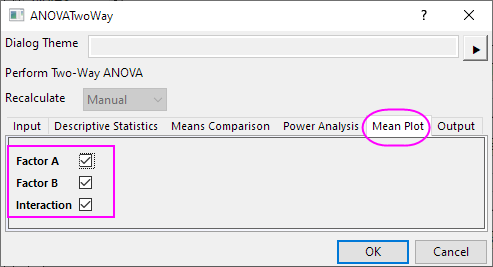
- We will get the Interaction plot
Recalculate
- Click on the green lock in the ANOVA2Way1 result sheet, and select Change Parameters to open the dialog again.
- In the Input tab in the open dialog, clear the interactions box and click the OK button.
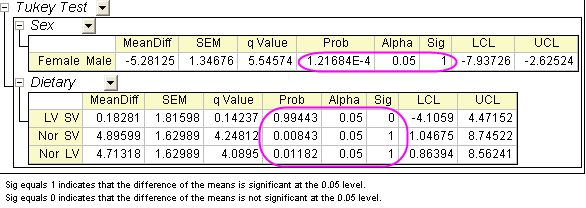
We can see that the Dietary and Sex are significant factors from the "Overall ANOVA" table. The mean of Nor is significantly greater than that of LV and SV for factor Dietary. The mean of Male is significantly greater than that of Female, from the "Dietary" table.
Raw Data Mode
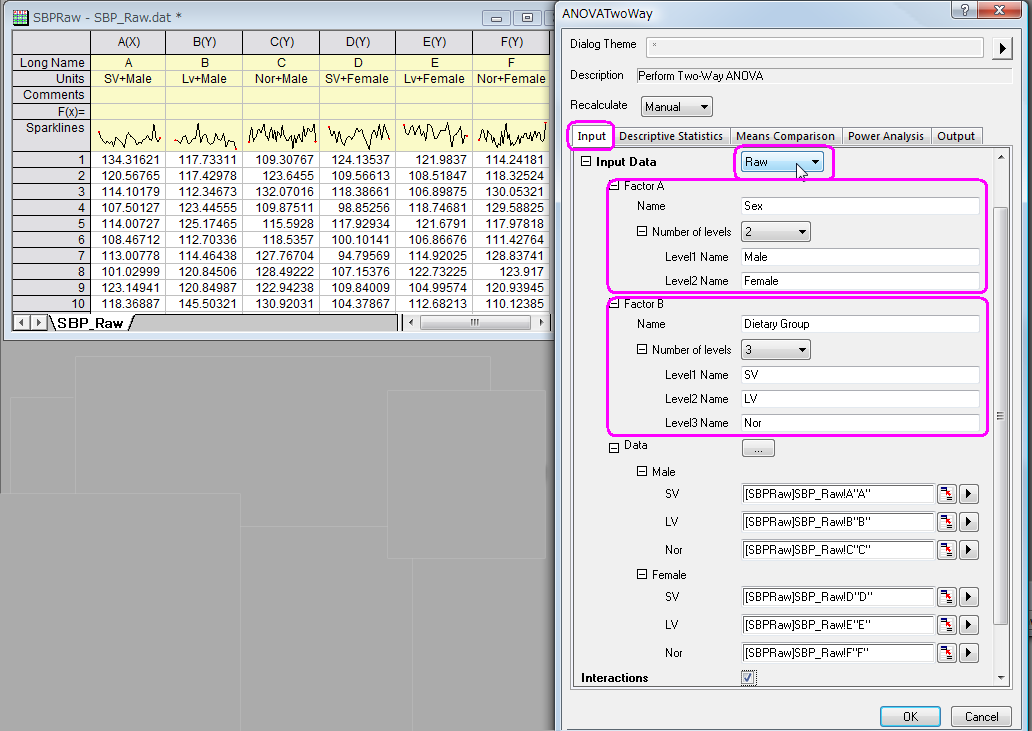
- Start with a new workbook and import the file \Samples\Statistics\SBP_Raw.dat
- Highlight all columns and select menu item Statistics : ANOVA : Two-Way ANOVA to bring up the ANOVATwoWay dialog box. In the Input tab, choose Raw as the Input Data mode.
- Also in the Input tab, set Number of levels of Factor A as 2 and type Sex ,Male and Female for Name,Level1 Name and Level2 Name in Factor A branch ,respectively.
- Also in the Input tab, set Number of levels of Factor B as 3, and type Dietary Group ,SV ,LV and Nor for Name,Level1 Name, Level2 Name and Level3 Name in Factor A branch, respectively.
- In the Means Comparison tab, set Significance Level to 0.05, and check the box beside Tukey to use it as the means comparison method.
- Click the OK button to perform Two-Way ANOVA.
|