4.5.1 MathematicsMathematics
Interpolate Data on given X Vector
pe_mkdir Interp1 path:=aa$;  //make a folder in the project named Interp1
pe_cd aa$; //open the folder Interp1 in project

newbook;
newsheet cols:=4 xy:="XYXY";
impasc fname:="%@JSamples\Mathematics\Interpolation.dat"; // import sample data using %@JSamples, which points to the Samples folder

Range rTime1 = 1; // col(1) of active sheet
Range rData1 = 2; // col(2) of active sheet
Range rTime2 = 3; // col(3)
Range rData2 = 4; // col(4)

interp1 ix:=rTime2 iy:= rData1 method:= spline ox:=rData2 ;

plotxy iy:=rData1 plot:=200 color:=1;
plotxy iy:=rData2 plot:=200 color:=2 ogl:=1;
The following example calculate the spline interpolation and create line plot for the data imported from file.
//import data from the samples folder
string fname$ = system.path.program$ + "Samples\Curve Fitting\Exponential Decay.dat";
newbook s:=0;
newsheet cols:=4 xy:="XYYY";
impasc;

//interpolate on the specified columns
for(i=2;i<5;i++){
interp1xy -r 2 iy:=[ExponentialDe]1!$(i) method:=spline npts:=200;
}

plotxy ((1,5),(1,6),(1,7)) plot:=200; //create line plot
Average Curves
This example shows how to average multiple XY data that are monotonic in X but do not necessarily share X values.
/*
The sample data used is in OriginPath\Samples\Spectroscopy\DSC\Data folder

1. Load the data to different worksheets of the same book
2. use avecurves XF to average the A(X)B(Y) of all the sheets.
3. put the result into a new sheet
4. Plot the original into one graph and the averaged data into another graph
*/

// Load the sample data to separated sheets, using existing
// loadDSC.ogs
string LoadDSCogsPath$=system.path.program$ + "Samples\LabTalk Script Examples\LoadDSC.ogs";
%A=LoadDSCogsPath$;
if(!run.section(%A, Main, 0))
	break 1;
// Data should be loaded now into active book
string dscBook$=%H;
// plot all the data A(X), B(Y) first
plotxy [dscBook$](1:end)!(1,2) plot:=200;

// Perform average on all the sheets data using interp average method with linear interpolation
avecurves iy:=[dscBook$](1:end)!(1,2) rd:=[<input>]<new name:="Averaged Data">! method:=ave interp:=linear;
// plot the averaged as well
plotxy [dscBook$]"Averaged Data"!(1,2) plot:=200 ogl:=[<new>]<new>!;
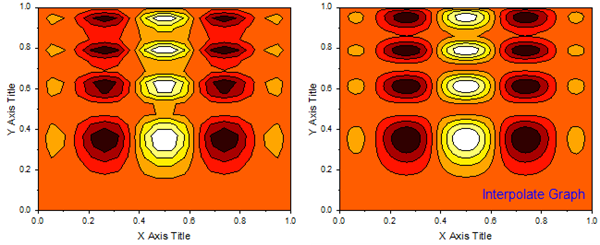
2D Interpolate
2D Interpolation/Extrapolation can be performed on matrix by using X function minterp2.
newbook name:=MyMatrix1 mat:=1;

//set matrix dimision and values
matrix -ps DIM 20 20;
matrix -ps X 0 1;
matrix -ps Y 0 1;
matrix -v x*(1-x)*cos(4*PI*x)*sin(4*PI*y^2)^2;
//interpolation with spline method
minterp2 -r 2 im:=<active> cols:=50 rows:=50 xmin:=0 xmax:=1 ymin:=0 ymax:=1 om:=Interp;

//plot the original matrix into contour graph
plotm im:=[MyMatrix1]1! plot:=226 ogl:=<Contour>;
layer.cmap.load(Fire.pal,0);
//plot the results matrix into contour graph
plotm im:=[Interp]1! plot:=226 ogl:=[<new>]<new>;
layer.cmap.load(Fire.pal,0);
sec -p 0.1;
layer.matmaxptsenabled=0; // Turn off speed mode
Polygon Area
Assume you have the hysteresis loop just like this graph, you can use the script below to calculate the area of the Polygon.
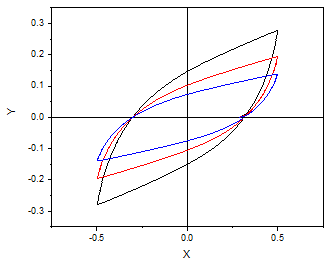
//Active the graph
type Dataset     Loop Area;
doc -e d // Loop through all plots in active graph window
{
polyarea iy:=%C type:=1;
type %C       $(polyarea.Area,%2.2f);
}

/*Results table
Index     Loop Area
Book1_B      0.23
Book1_C      0.16
Book1_D      0.11
*/
|