2.26 General Linear Regression (Pro)GLR
Summary
The General Linear Regression app is used to fit the classical linear model to a set of continuous, normally-distributed, homoscedastic, and independent observations (dependent variable) against any combination of categorical or continuous predictors (independent variables), estimating the linear relationship between them via ordinary least squares.
 | Relative Topics:
|
Tutorial
Sample Data
This tutorial uses an online .csv file. Please use Web Connector to import the sample data:
- Select menu Data: Connect to Web.
- Copy the following link and paste it to the URL edit box of the Connect to Web dialog.
https://blog.originlab.com/wp-content/uploads/2026/01/GLRSampleData.csv
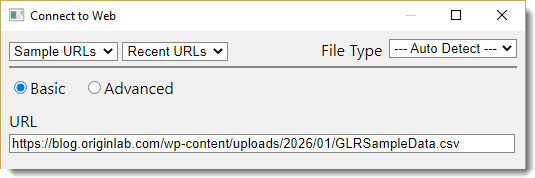
- Click OK to import.

To identify the most effective levers for boosting torque, power-train engineers ran bench tests that combined two fuels (column A), two aspiration types (column B), five valve-train architectures (column C), and a continuous sweep of bore diameters (column D) and stroke lengths (column E). They then use General Linear Regression to fit the data to quantify each factor's marginal contribution to peak torque.
Steps
- Click the General Linear Regression icon
 in the Apps Gallery (docked at the right side of workspace) to open the dialog. in the Apps Gallery (docked at the right side of workspace) to open the dialog.
- In the Input tab, set as follow:
- Dependent Variables = col(F)"Torque",
- Continuous = col(D)"Bore Diameter" and col(E)"Stroke"
- Categorical = col(A)"Fuel", col(B)"Aspiration", and col(C)"Engine".
- Under Reference Factor Level sub-branch, make sure "GAS" is set for Fuel, “TURBO” for Aspiration, and "OHCV" for Engine, respectively.

- In the Settings tab,
- make sure Model Type is set to Main Effects to fit only the main effects (Bore Diameter, Stroke, Fuel, Aspiration, Engine) and omit all interactions.
- leave Coding Type as (1,0) to estimate the mean difference between each level and the Reference Factor Level.
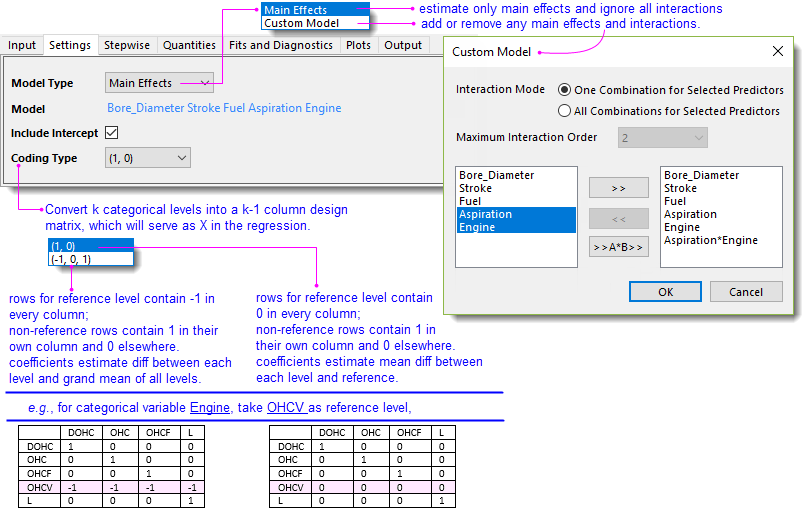
- Accept all other default settings and click OK.

Results and Explanations
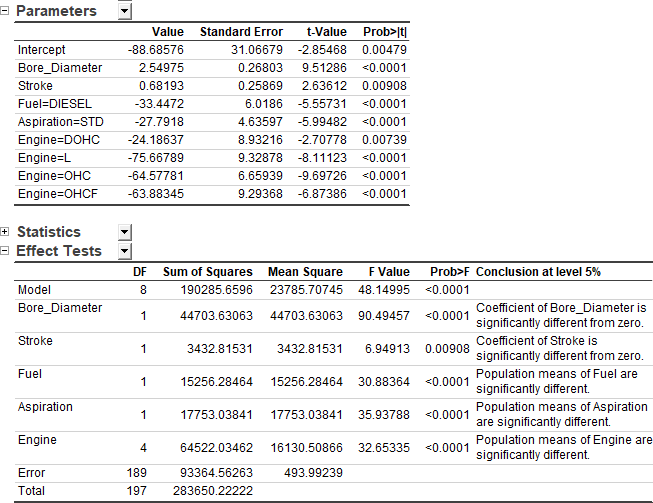
- Parameters Table
- Intercept
-88.68576 N·m represents the predicted mean Torque used as "reference", when Fuel = GAS, Aspiration = TURBO, Engine = OHCV, Bore Diameter = 0 mm, and Stroke = 0 mm (0 is a purely mathematical zero). This Intercept is considered the "baseline" and all other effects listed below are deviations from it.
- All
p < 0.05. At the level of 0.05, all variables significant influence torque. This can also be confirmed by the Effect Tests table.
- For continuous variables, Bore_Diameter:
2.54975, each 1 mm increase in bore diameter raises mean torque by 2.55 N·m; similarly, each 1 mm increase in stroke raises it by 0.68 N·m.
- For categorical variables, Fuel = DIESEL:
–33.4472, indicating diesel reduces torque mean by -33.45 N·m; similarly, all non-reference levels of Aspiration (= STD) and Engine (= OHC, OHCF, DOHC and L) show negative coefficients versus reference level. Thus, the reference level combination, Fuel =GAS, Aspiration = TURBO, Engine = OHCV, gives the highest predicted torque.
- Effect Tests Tables
- The Parameters table quantifies torque gain per 1 mm bore diameter/stroke length and the large drop when switching fuel, aspiration, or engine types. Together with the F Value in the Effect Tests table, bore diameter gives the steepest marginal increase, while categorical variables shift torque by roughly the same magnitude. This would provide a worthy reference on future design tuning.
Post-process: Optimize
After the GLR analysis, Origin provides an Optimizer tool to find the best factor settings for the target response, based on the fitted model.
For example, engineers want to find the combination of bore diameter and stroke length that maximizes torque while keeping the engine GAS-Turbo-OHCV.
- Activate the GLR Report sheet. Move the mouse to the page edge until the cursor changes into
 . Left-click and from the popped-up mini-toolbar, select the Optimizer button. . Left-click and from the popped-up mini-toolbar, select the Optimizer button.

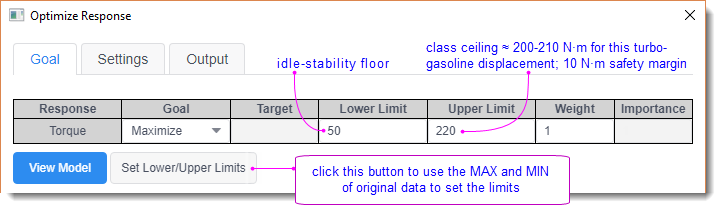
- In the Optimize Responese dialog, set as follow:
- In Goal tab, set Torque Goal to Maximize. Specify Lower Limit = 50, Upper Limit = 220.
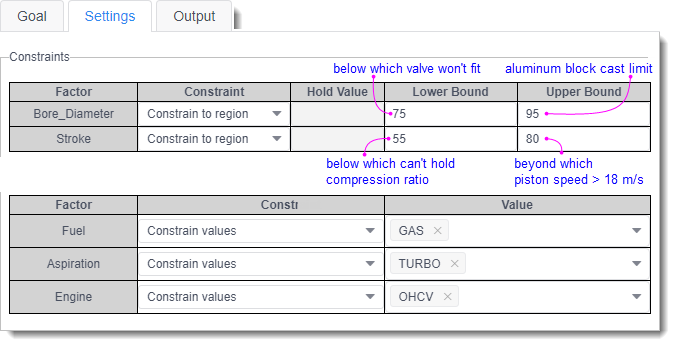
- In Settings tab, lock or bound each factor:
- Fuel : Constrain values = GAS
- Aspiration : Constrain values = TURBO
- Engine : Constrain values = OHCV
- Bore_Diameter : Constrain to region = [75, 95]
- Stroke : Constrain to region = [55, 80]
- Click OK to generate report.

- Solution table: within the specified feasible window (Bore 75–95 mm, Stroke 55–80 mm, Fuel = GAS, Aspiration = TURBO, Engine = OHCV), torque peaks at the upper-right corner of the response surface: Bore = 90 mm, Stroke = 80 mm.
Because both continuous factors show positive, nearly linear coefficients (which can be confirmed in the Optimization Plot), the algorithm simply rides the gradient until it hits the data-extent boundary at 90 mm bore (limited by the boundary of Torque we specified, even though the bore upper limit we set is 95 mm).
- Prediction table gives the maximum fitted Torque value
195.34575 N·m under the Solution configuration.
- Double-clicking on the Optimization Plot to open it in a separate window. Drag the red slider in each factor panel to see how torque changes in real time.
|