
|
Skip Navigation Links.
|
Contour Plot Representing Water Sample Data
|
|
|
Show more of same type... Show more using same keywords...
Download this project to learn how to make the graph.
|
|
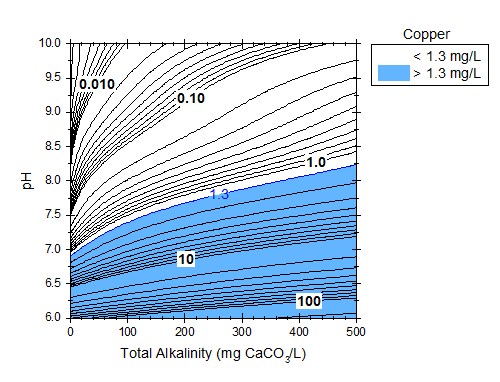
This graph represents the predicted copper(II) concentration in water samples (Z values are copper solubility) in relation to pH and alkalinity through a double plot contour graph with levels set on a Log10 scale. To set the color as well as the contours, a two layer method was employed by plotting the same data twice on the graph using the Layer Contents dialog. The X values for this plot are the alkalinity of water samples (milligrams of calcium carbonate per liter), the Y values represent the pH and the Z contours show the concentration of Cu, assuming copper levels are controlled by solubility of the solid cupric hydroxide. The contour labels indicate that copper solubility drops at higher pH levels, but increases greatly with rising alkalinity. Additionally for low pH levels and low alkalinities, the copper solubility changes quite rapidly. Conversely, for higher pH levels and alkalinities, the copper solubility is more stable. The first plot was set as a regular contour plot with no filled color and the labels for specific contours were added using the Labels feature in the Plot Details dialog. The standard regulatory level for Cu concentration in water is 1.3 mg/L; in order to emphasize this level, the second plot was set at two levels with the first level set to white and the second to light blue, and the Contour line width was increased and color set to blue. Examining the graph shows that to remain below the health-based maximum contaminant level goal (in the US) of 1.3 mg/L (the light blue part of the graph) the pH needs to be below around 7 - 8.25 for alkalinity levels between 0- 500 CaCO3/L.
This graph was contributed by Michael Schock from the Water Supply and Water Resources Division of the United States Environmental Protection Agency.
|