Description
This graph calculate the 2D integration volume, FWHM and maximum using 2D Integration gadget. This gadget allows you to calculate the 2D integration for a contour or image graph created from matrix or XYZ worksheet data.
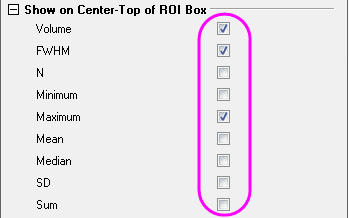
The rectangle represents the desired region to implement 2D Integration gadget. Move the rectangle around to select desired region to integrate. Click on the arrow button at the top-right corner of the triangle to display fly-out menu for customizing settings. Inside ROI tab of 2D Integration Preference Dialog, a number of parameters(Volume, FWHM, Minimum, Maximum, etc) can be selected to display.