Back to Top
OriginLab Corporation - Data Analysis and Graphing Software - 2D graphs, 3D graphs, Contour Plots, Statistical Charts, Data Exploration, Statistics, Curve Fitting, Signal Processing, and Peak Analysis      
Buy Now Try Demo
Skip Navigation Links.

3D Scatter with Line Projection and Drop Line


Show more of same type...            Show more using same keywords...

Download this project to learn how to make the graph.


This 3D scatter plot displays the House Price Index (HPI) vs. the number of houses for sale in US in the past 5 years.

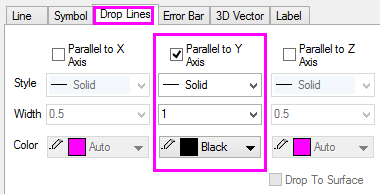
Drop lines parallel to the Y axis are turned on in the Plot Details dialog box, Drop Lines tab.

The blue line in the XZ plane is the projection of a more detailed dataset, plotted in 3D space with the symbols hidden.

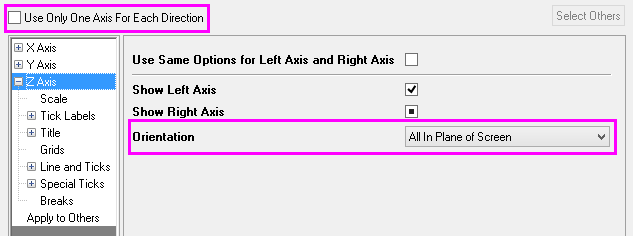
All axis ticks, labels and titles are oriented in the plane of the screen. The second Z Axis is turned on in the Axis Dialog box.

© OriginLab Corporation. All rights reserved.
× _ Let's Chat