This graph shows the calculated resonant inelastic x-ray scattering spectrum from nickel oxide. In this technique, x-rays of very specific energies are scattered off of a sample and their energy loss is recorded. The strong sharp peaks in this graph are d-d excitations, where the nickel 3d electrons are rearranged into higher energy configurations. The weaker, broader features correspond to charge transfer excitations, where an oxygen electron has transferred to a nickel atom. By analyzing the energies of the various excitations, researchers can extract important information about the electronic properties of the material, including the character and magnitude of its electronic band gap.
The data is displayed in a OpenGL-based color map surface plot, using the new lighting feature makes the graph much nicer to view.
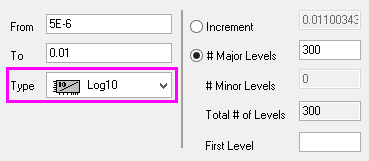
Color mapping was set to logarithmic scaled to show weaker features more clearly. A "Rainbow" palette was applied.
This graph was created by Dr. Robert Green, University of British Columbia.