This graph is a 3 dimensional representation of a three component (aka. ternary) system.
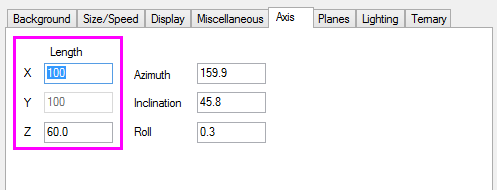
The graph was resized in the Z direction in Plot Details dialog, Axis tab for a desirable aspect ratio for the presentation.
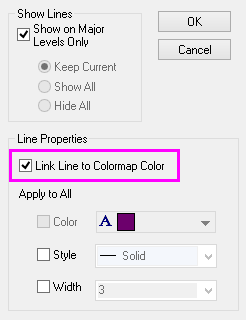
A contour line projection is added in the XYZ plane. The Link Line to Colormap Color option was selected to set the contour line color.
A 3D scatter plot with labels and leader lines was added to the plot to display the eutectic points. The leader line color, width and connecting method were set using the LabTalk "set" command.