Back to Top
OriginLab Corporation - Data Analysis and Graphing Software - 2D graphs, 3D graphs, Contour Plots, Statistical Charts, Data Exploration, Statistics, Curve Fitting, Signal Processing, and Peak Analysis      
Buy Now Try Demo
Skip Navigation Links.

Geographical Contour with Missing Values


Show more of same type...            Show more using same keywords...

Download this project to learn how to make the graph.


This is a geographical contour plot with color scale linked to elevation. Missing elevation values are represented by hatching.

The color scale object is by default vertical. It was set to be horizontal by simply resizing the object.

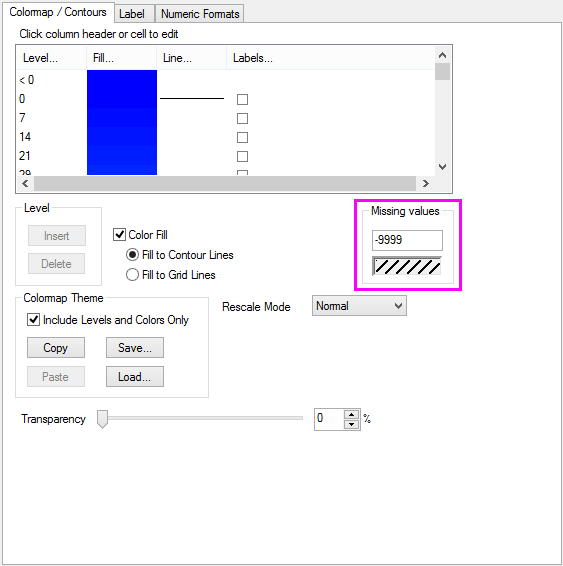
The missing value fill pattern can be specified in Colormap/Contours tab.

© OriginLab Corporation. All rights reserved.
× _ Let's Chat