Description:
This graph has multiple overlapping layers, where each layer contains a box chart. The standard deviation (SD) value for the box range have been set to 1, 0.95, 0.75 and 0.5 respectively. The box width have been set to 0, 30, 70 and 100.
The box style and width can be customized in the Box tab of the Plot Details dialog.
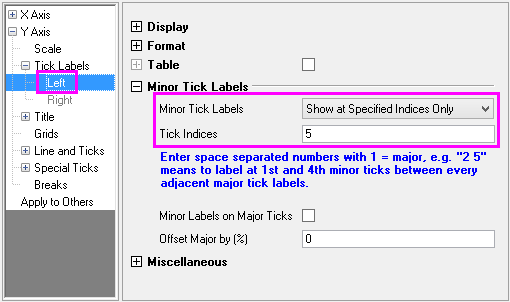
The left axis has been set to logarithmic scale, where the tick label has been customized to only display the
5th minor tick. This was done by selecting Show at Specified Indices Only option in the Axis Dialog, Minor Tick Labels branch.