Back to Top
OriginLab Corporation - Data Analysis and Graphing Software - 2D graphs, 3D graphs, Contour Plots, Statistical Charts, Data Exploration, Statistics, Curve Fitting, Signal Processing, and Peak Analysis      
Buy Now Try Demo
Skip Navigation Links.

Contour profile Plot with contour line


Show more of same type...            Show more using same keywords...

Download this project to learn how to make the graph.


Description:

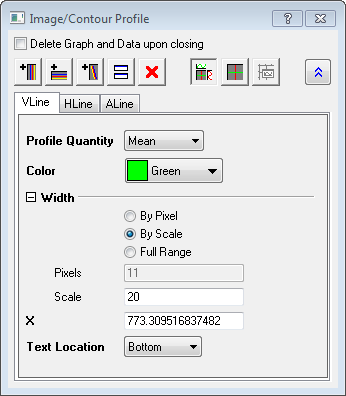
The coutour profiles plot provides a quick way to analyze the contour data and generate profiles. You can create horizontal, vertical and arbitrary line profiles of the contour data dynamically. Multiple horizontal and vertical profiles supported on the same plot.

In the Image Profiles dialog, you can customize thickness, color and the positon of profile lines.

© OriginLab Corporation. All rights reserved.
× _ Let's Chat