Description:
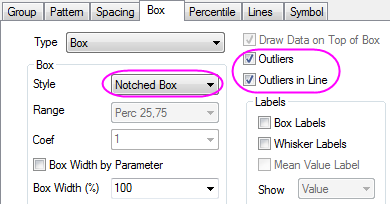
This graph charts fertility rates in the USA from 1980 to 2010. A notched box style with fill pattern is used, and outliers are shown in-line with the box.
The notched box style and outlier display can be enabled in the Box tab of the Plot Details dialog box.
