Description:
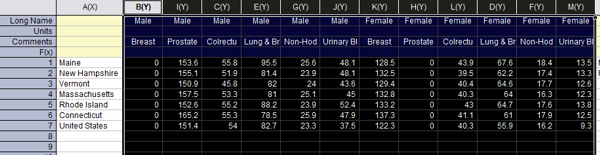
This is an example of a grouped stacked bar plot. Select and plot your graph as a standard bar plot. From the menu, click Plot:Column/Bar/Pie:Bar.
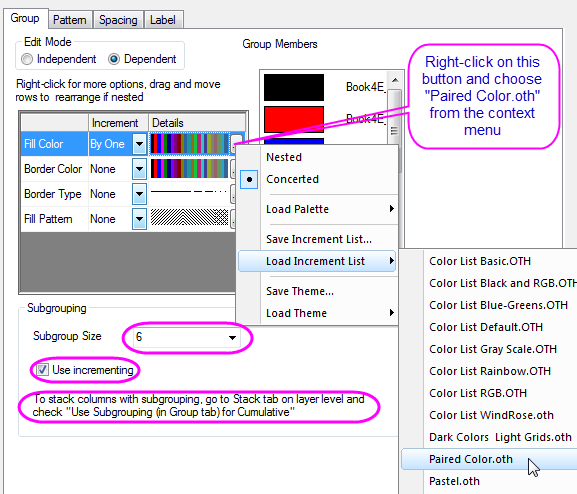
With the bar plot active, click Format:Plot Properties. Subgroup size can be set in the Group tab of Plot Details ...
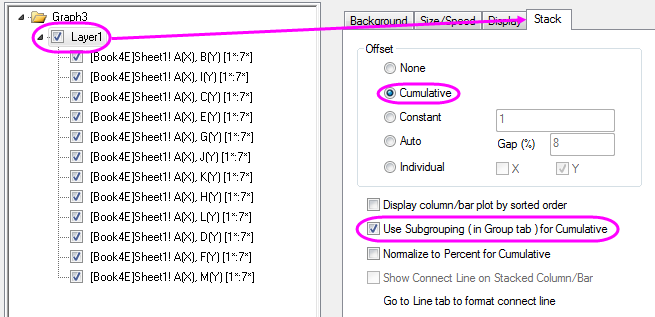
... and enabled using controls on the Stack tab of Plot Details.
Other plot customizations shown include adding a graph title, labeling of the "Female" and "Male" bars and customizing the horizontal axis scale to make it more legible.
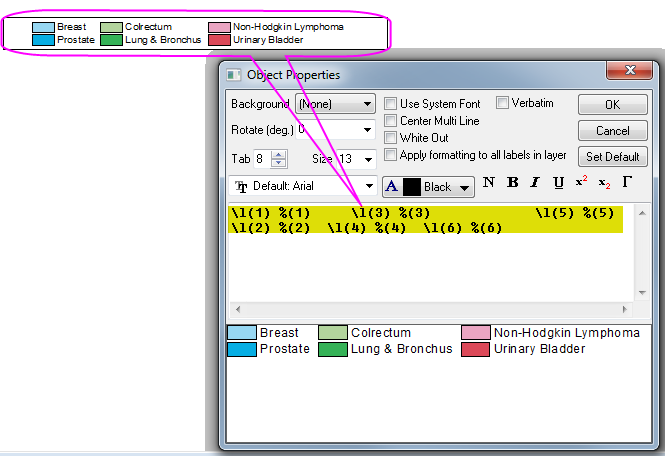
Finally, you can remove the redundant information from the graph legend and rearrange the plot symbols by right-clicking on the legend object and choosing Properties....