Description:
This is a 3D Histogram graph from the bivariate data. In this sample, there are 1000 test results for the material strength and hardness. To show the frequency distributions for two related variables (strength and hardness), use 2D Frequency Count Binning tool to statistics XY data frequency, and a 3D bar graph of the result can be generated to provide an intuitive demonstration of the distribution of the data points.
|
|
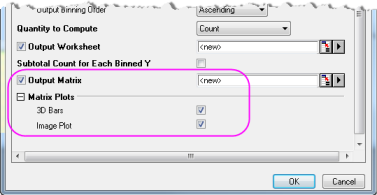
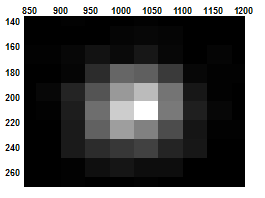
Image Plot
|
|
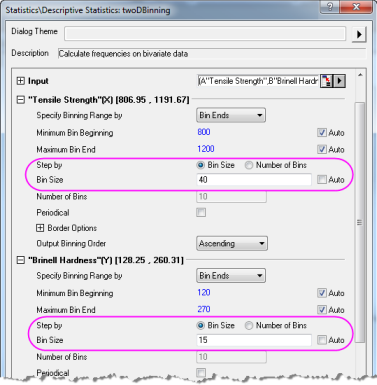
In the 2DBinning dialog, specify the way to increase and the fixed step size for X/Y bins.
|
|
In the 2DBinning dialog, check Ouput Matrix , 3D Bars and Image Plot, then a matrix with the counts in two dimensions, a 3D bar graph and a Image plot will be created.
|