
|
Skip Navigation Links.
|
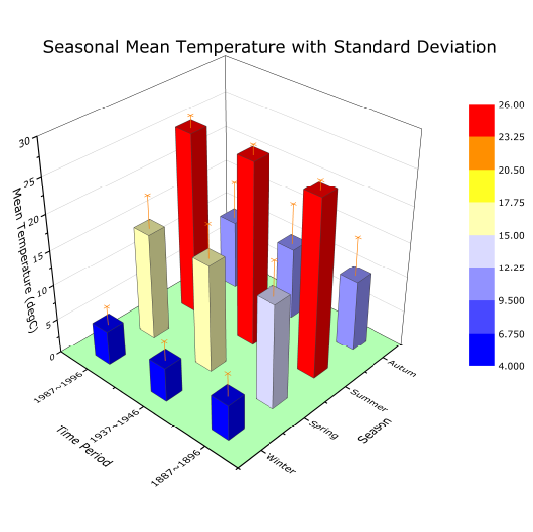
3D Bar Plot with Error Bars
|
|
|
Show more of same type... Show more using same keywords...
Download this project to learn how to make the graph.
|
|
Description:
This graph shows a 3D bar plot with error bars. The 3D bars display the seasonal mean temperature during a period of time, and the error bars indicate the standard deviation. Z Colormap is used in the bar plot.
|