Description;
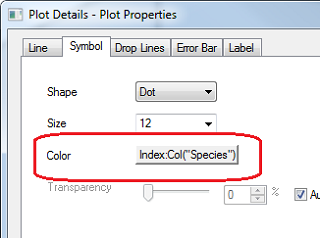
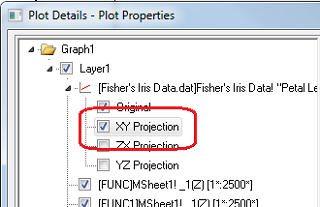
This graph depicts a 3D Scatter plot combined with 3D Parametric Surfaces. The worksheet contains the data for the 3D scatter plot, which consists of three different species. The symbol color has been set using the categorical species data, and the scatter points have also been projected onto the XY plane as shown below.
 |
|
 |
Set symbol color into Indexing/Col("Species"). |
|
Check XY Projection. |
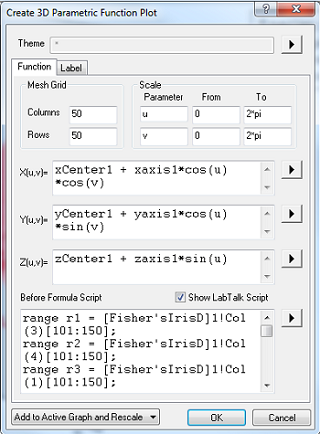
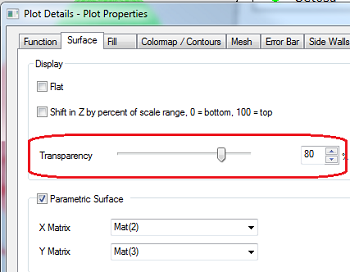
Three ellipsoids have been added by creating parametric functions with the axes computed such that all data points in each group are contained within the ellipsoid. The ellipsoid surfaces have been set as transparent to allow viewing of the scatter points inside.
 |
|
 |
Create 3D parametric function plot. |
|
Set surfaces as transparent. |