Back to Top
OriginLab Corporation - Data Analysis and Graphing Software - 2D graphs, 3D graphs, Contour Plots, Statistical Charts, Data Exploration, Statistics, Curve Fitting, Signal Processing, and Peak Analysis      
Buy Now Try Demo
Skip Navigation Links.

Mount St. Helens before and after eruption


Show more of same type...            Show more using same keywords...

Description:

This graph consists of two 3D surfaces with color map, showing the topology of Mount St. Helens before and after its catastrophic eruption on May 18, 1980.

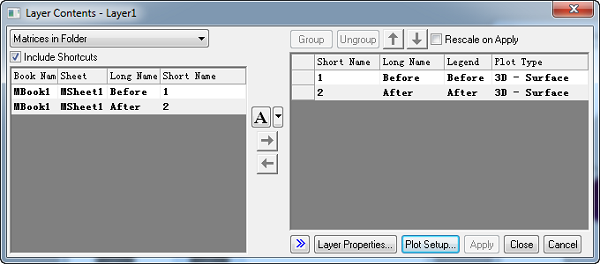
The graph layer contains two matrix data plots. The matrices “before” and “after” are used to plot the images of the volcano before and after its eruption.

The second plot is shifted along the Z axis to allow easy viewing of each surface.

© OriginLab Corporation. All rights reserved.
× _ Let's Chat