Description:
This is a matrix-based 3D bar graph with Z values as color map. There are two kinds of 3D bar graph in Origin, 3D XYY Bars from worksheet and 3D Bars from a Z matrix.
 |
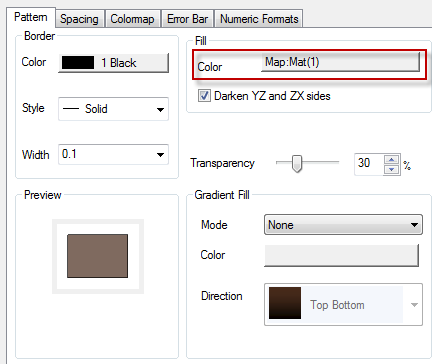
The Pattern tab provides controls to customize the display of matrix-based 3D bar graphs. These controls include the bar border, fill and transparency, as well as the bar widths.
You can fill the bars with color mapping of the Z-values as shown in the image above.
|