Back to Top
OriginLab Corporation - Data Analysis and Graphing Software - 2D graphs, 3D graphs, Contour Plots, Statistical Charts, Data Exploration, Statistics, Curve Fitting, Signal Processing, and Peak Analysis      
Buy Now Try Demo
Skip Navigation Links.

Wire Frame Surface Plot


Show more of same type...            Show more using same keywords...

Description:

This is a wire frame surface graph. In this graph, the Z values determine a surface of X and Y grid lines with secondary lines between the grids.

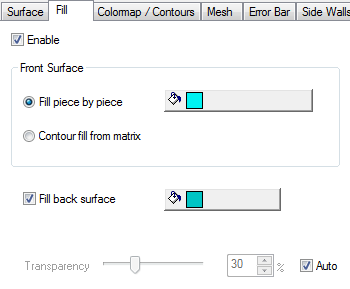
The Wire Frame tab provides controls for customizing Wire Frame and Wire Surface graphs. It offers options to customize the Grids, Back Color, Transparency, etc.


© OriginLab Corporation. All rights reserved.
× _ Let's Chat