Show more of same type... Show more using same keywords...
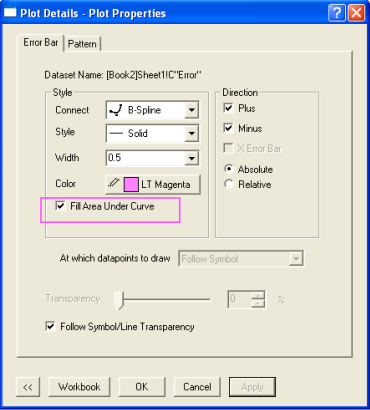
Description: This graph is a Line + Symbol plot with error bar. The source data contains three columns: Angular, Radius, and Error of Radius. In this graph, draw error bars as lines, with fill color between error bars and data.
Description:
This graph is a Line + Symbol plot with error bar.
The source data contains three columns: Angular, Radius, and Error of Radius. In this graph, draw error bars as lines, with fill color between error bars and data.