Description:
This is a waterfall shows one trace highlighted.
The waterfall graph can be used to compare variations between multiple data sets created under similar conditions. Each data set is displayed as a line data plot which is offset by a specified amount in both the X and Y direction.
 |
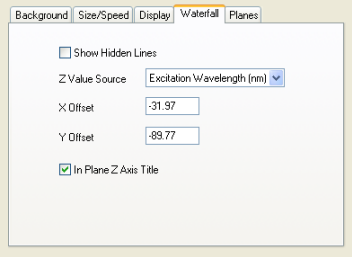
This tab is only available when you create a Waterfall graph.
In this tab, you can specify if show the hidden lines, specify the Z Value source and change X and Y offset between adjacent plots. |