Description:
This graph displays an overlay contour plot in which two datasets have been plotted as contour plots in one graph layer. The color filled contour represents global surface temperature data, and the green contour lines represent sea level pressure. The data used to create this graph was obtained from the NCL website: http://www.ncl.ucar.edu/Applications/Data/
Origin allows you to plot data as a contour with or without color fill.
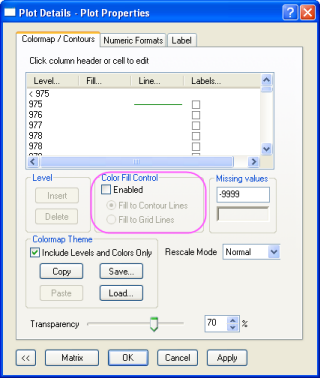
Clear the Enable check box in the Color Fill control group to plot a contour without fill color (see the green contour lines in the example graph). |
|
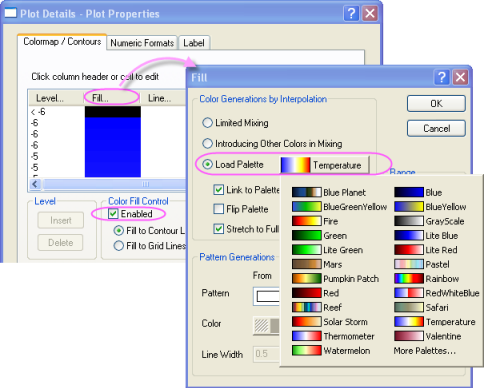
With the Enable check box selected, click the Fill… column header to customize the contour color. Click the Load Palette radio box to load built-in or user-defined palettes (see the color-filled contour in the example graph).
In this dialog, Origin offers multiple ways to generate fill color by interpolation. See more details here.
|