Description:
This is an overlay contour plot. The color-filled contour with associated color scale displays data stored in an Origin matrix. Multiple peaks in the data were fitted with the 2D Gaussian peak function. The white contour lines represent the fit matrix generated by the curve fitting tool. These contour lines are labeled with the Z value from the fit matrix. By overlaying the two contour plots one can view fit results directly on top of the raw data.
Use the Layer Contents dialog to plot two contour plots overlaid in a single graph layer.
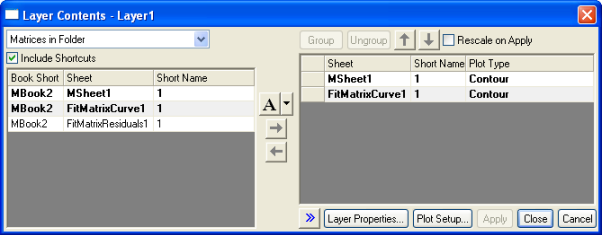
In the Layer Contents dialog, available datasets are listed in the left panel according to your selection in the upper-left dropdown menu. The right panel lists datasets plotted in the current layer. Use the Plot Type and Arrow buttons between the two panels to add or remove datasets and to specify appropriate plot types for the datasets. See more details about this dialog here. |