Learn how to create this graph here.
Description:
This graph consists of a 3D scatter plot with error bar and a 3D color fill surface.

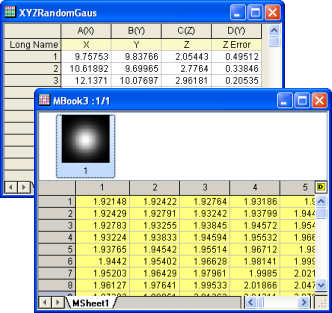
The scatter plot is created from the first three columns of the worksheet data. The fourth column is used for the error in the Z direction. The 2D Gaussian surface is created from the matrix. |
|

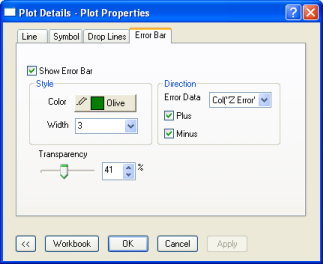
The 3D Error Bar tab provides controls for Style, Direction, and Transparency of the 3D Error Bar. Note that the 3D Error Bar can only be created with 3D Scatter plots and 3D Surface plots. |