Description:
This graph displays a symbol plot of XY data where the size of the symbol and its color have been mapped to two other data columns in the worksheet: Mass and Type.
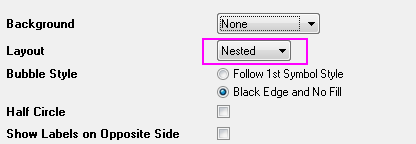
A bubble scale object, customized as Nested style, has been added to this graph to illustrate the sample dimension of X or Y axis.
Color transparency has been applied to the plot so that overlapping data points are visible. Transparency control is available in the Plot Details dialog for various plot elements, such as symbol fill color and surface color.
 |
 |
The worksheet contains four columns: The Width column stores X data, the Length column stores Y data, the Mass column controls the symbol size, and the Type column controls the symbol color. |
In Plot Details, choose the column controlling symbol size (the Mass column, in this case) from the Size drop-down list, and also set a Scaling Factor, if needed. Select Symbol Color, and then Indexing to reveal a menu of up to 255 columns in the current worksheet.
Move the Transparency slider or enter a number between 0 and 100 in the combination box to set transparency for symbols. |