
|
Skip Navigation Links.
|
2D Graph with Inset Plot Depicting Fitting Results
|
|
|
Show more of same type... Show more using same keywords...
Download this project to learn how to make the graph.
|
|
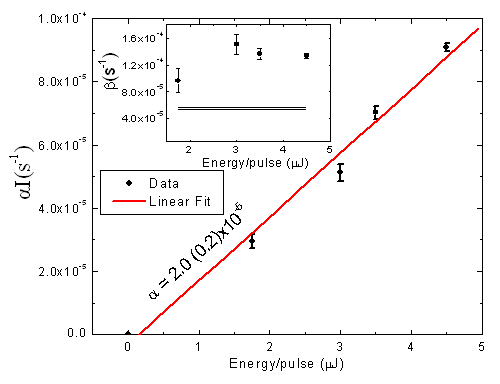
The graph shown here depicts plotted fit parameters and uncertainties obtained after fitting decay and recovery curves. To learn more about the graph, read the case study.
|