Dissolved Solids Circulation in Las Vegas Bay, Lake Mead, USA
By Dr Michael R. Rosen, U.S. Geological Survey and adjunct professor in the Dept. Geological Sciences and Engineering, and the Hydrological Sciences Program, University of Nevada, Reno
This study is aimed to determine how the overall dissolved solids (measured as specific conductance) entering Las Vegas Bay from a tributary called Las Vegas Wash changed over the year. Las Vegas Wash receives urban runoff and tertiary treated wastewater from the City of Las Vegas and knowing how this water circulates and mixes into the lake are important for predicting possible algal blooms and protecting the health of aquatic organisms.
Monthly water quality data are collected at different depths in the water column from Lake Mead, located in Nevada and Arizona. More than 100 measurements are analyzed each month at various depths and distances within Las Vegas Bay. Origin's advantage of organizing data into useful graphs is used here. The pictures below are the color fill contour program of results from three months during the year. The overlayed black dots are the sampling points. When Las Vegas Wash water enters Las Vegas Bay in the spring, it either floats on the top of the lake water (warmer and less dense) or stays in the middle of the water column (this is called interflow) because the density and temperature are about the same as the lake water. Later in the year (in the summer) Las Vegas Wash water is much warmer due to the arid climate and floats near the surface. In the winter when Las Vegas Wash water is colder, the water sinks to the bottom and carries most of the nutrients and chemicals to the bottom of Las Vegas Bay.
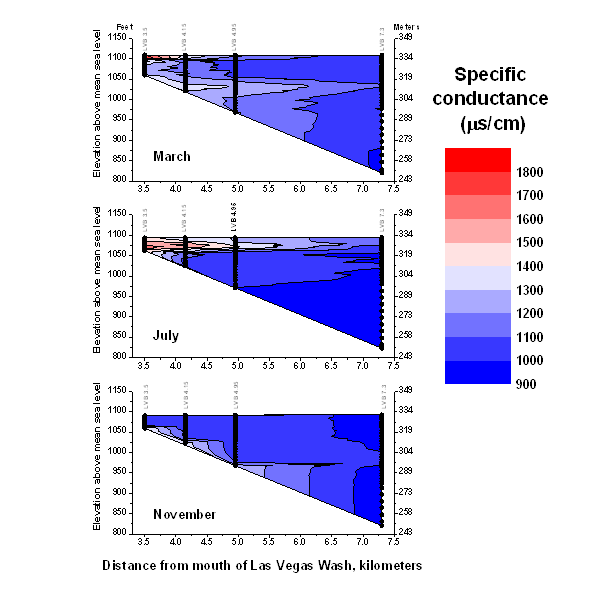
With Origin, each month’s data is plotted as color filled contour diagram without having to arrange it into individual site data. This made plotting the data very quick and simple. Each month plotted was then merged onto one template and made into one graph to show the differences over the year. This provides visualized help to know when Las Vegas Wash water is entering different parts of the lake and allows models of circulation to be constructed that can predict distribution of chemicals throughout the year.