Julian Borejdo at the University of North Texas Health Science Center at Fort Worth studies the fundamental behavior of muscle tissue. The goal of his research is to identify defects in heart muscle that lead to the often lethal heart disease Familial Hypertrophic Cardiomyopathy. He uses Origin for statistical analysis, visualizing frequency information in histograms and using non-linear curve fitting to identify modal behavior in the data.
The biophysics of muscle action boils down to the interaction of two protiens: actin and myosin. Actin forms thin rope-like filaments, while myosin forms a thicker filament with "heads" that bind to receptor sites on the actin filament. Myosin heads form cross-bridges between actin filaments, and swivel to create muscle tension or contraction. The addition of ATP allows the cross-bridges to swivel and, in the absence of Ca2+, to detach and the muscle to relax. If ATP is unavailable the cross-bridges cannot release and the muscle remains clenched as in rigor mortis.
Using a fluorescence polarization technique, Dr. Borejdo is able to capture the motions of a small number of myosin cross-bridges. Statistical accounting of these motions has revealed a single mode behavior for the rigor condition and bimodal behavior for muscle contraction. |
|
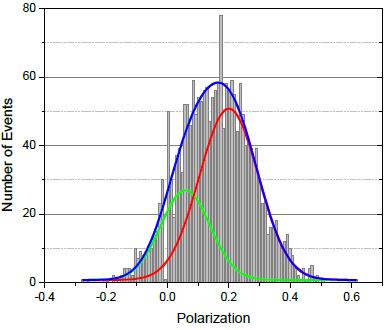
Histogram demonstrating bimodal behavior of myosin cross-bridge polarization during muscle contraction.
The graph was made using Origin’s frequency counting tool and histogram graph template, overlaid by two Gaussian fit curves. The two Gaussians are the product of replica fitting using Origin’s non-linear fitter.
|